Iowa is on pace to easily surpass its final 2014 early vote totals before Election Day. Democrats’ numbers are looking particularly strong, pulling away by a strong margin from Republicans in the last week. There are 35,192 more registered Democrats who have voted early than registered Republicans. At this point in 2014, Democrats held only a 6,829 lead.
Let’s dive in to all the numbers, including a look at what counties are turning out strongly for either party (as always, you can look at my full county spreadsheet here). First, here’s the current statewide early vote totals:
| Requested | Voted | |
| Dem | 230,001 | 195,469 |
| GOP | 185,373 | 160,277 |
| NP | 111,994 | 89,440 |
| Total | 530,336 | 447,454 |
| Diff | +44,628 Ds | +35,192 Ds |
Here’s where those numbers were at during this same point in the election four years ago:
| Requested | Voted | |
| Dem | 207,335 | 160,306 |
| GOP | 184,097 | 153,477 |
| NP | 110,646 | 77,441 |
| Total | 502,926 | 391,772 |
| Diff | +23,238 Ds | +6,829 Ds |
And here’s how much better each party’s numbers are now compared to this point in 2014:
| Requested | Voted | |
| Dem | +22,666 | +35,163 |
| GOP | +1,276 | +6,800 |
| NP | +1,348 | +11,999 |
| Total | +27,410 | +55,682 |
| Diff | +21,390 Ds | +28,363 Ds |
As you can see, Democrats’ early vote margin is nearly 30,000 votes better than it was at this point in 2014. And since they have a larger number of absentee requests still out there, that total could actually grow.
Now let’s compare the current numbers to the final early vote totals from 2014. This is where things start to look very good for Democrats:
| Final 2014 | Current 2018 | % Now | |
| Dem | 186,262 | 195,469 | 105% |
| GOP | 178,644 | 160,277 | 90% |
| NP | 99,487 | 89,440 | 90% |
| Total | 465,146 | 447,454 | 96% |
Democrats statewide have already surpassed their early vote totals for 2014, while Republicans are only at 90% of theirs.
Another number that is very positive for Democrats: their absentee ballot return rate is at 85.0% right now, while Republicans are at 86.5%. At this point in 2014, that number was 77.3% for Democrats and 83.4% for Republicans. That shows that Democratic voters and the party have done a better job this cycle of getting those absentee ballots back in (the shorter early vote window may be a factor here, too).
Where could the final number end up? Well, if every volunteer and staffer (on both sides) get their jobs done during GOTV, let’s say we end up with a 96% return for the absentee requests. That would boost the final numbers to somewhere around this:
| Final 2014 | If 96% return 2018 | If 96% return % | |
| Dem | 186,262 | 220,801 | 119% |
| GOP | 178,644 | 177,958 | 100% |
| NP | 99,487 | 107,514 | 108% |
| Total | 465,146 | 509,123 | 109% |
That would give Democrats a 42,843 early vote advantage on Election Day, compared to the 7,618 advantage they had in 2014. If we have time, we’ll do another post that looks at whether that’s enough of an improvement for Democrats to win (spoiler: it is, it just takes a while to explain with a whole lot of extra numbers).

Now let’s get to the maps to see where exactly these numbers are coming from and find some trends.
Let’s begin with a basic look of where the counties are compared to their 2014 numbers. Here’s the top 10 counties for total early votes compared to their final 2014 early votes:
| County | % of 2014 Total |
| Mills | 128% |
| Fremont | 125% |
| Dickinson | 124% |
| Dallas | 117% |
| Pottawattamie | 111% |
| Cass | 109% |
| Polk | 108% |
| Dubuque | 105% |
| Winneshiek | 105% |
| Lee | 104% |
Again, what you’re looking at with these percentages is this: Right now, 960 people have already voted early in Fremont County. In 2014, 770 people voted early in total in Fremont County. So, Fremont County is at 125% of its final 2014 early vote turnout, and obviously that will only climb as more ballots get returned in the mail and to the Auditor’s office.
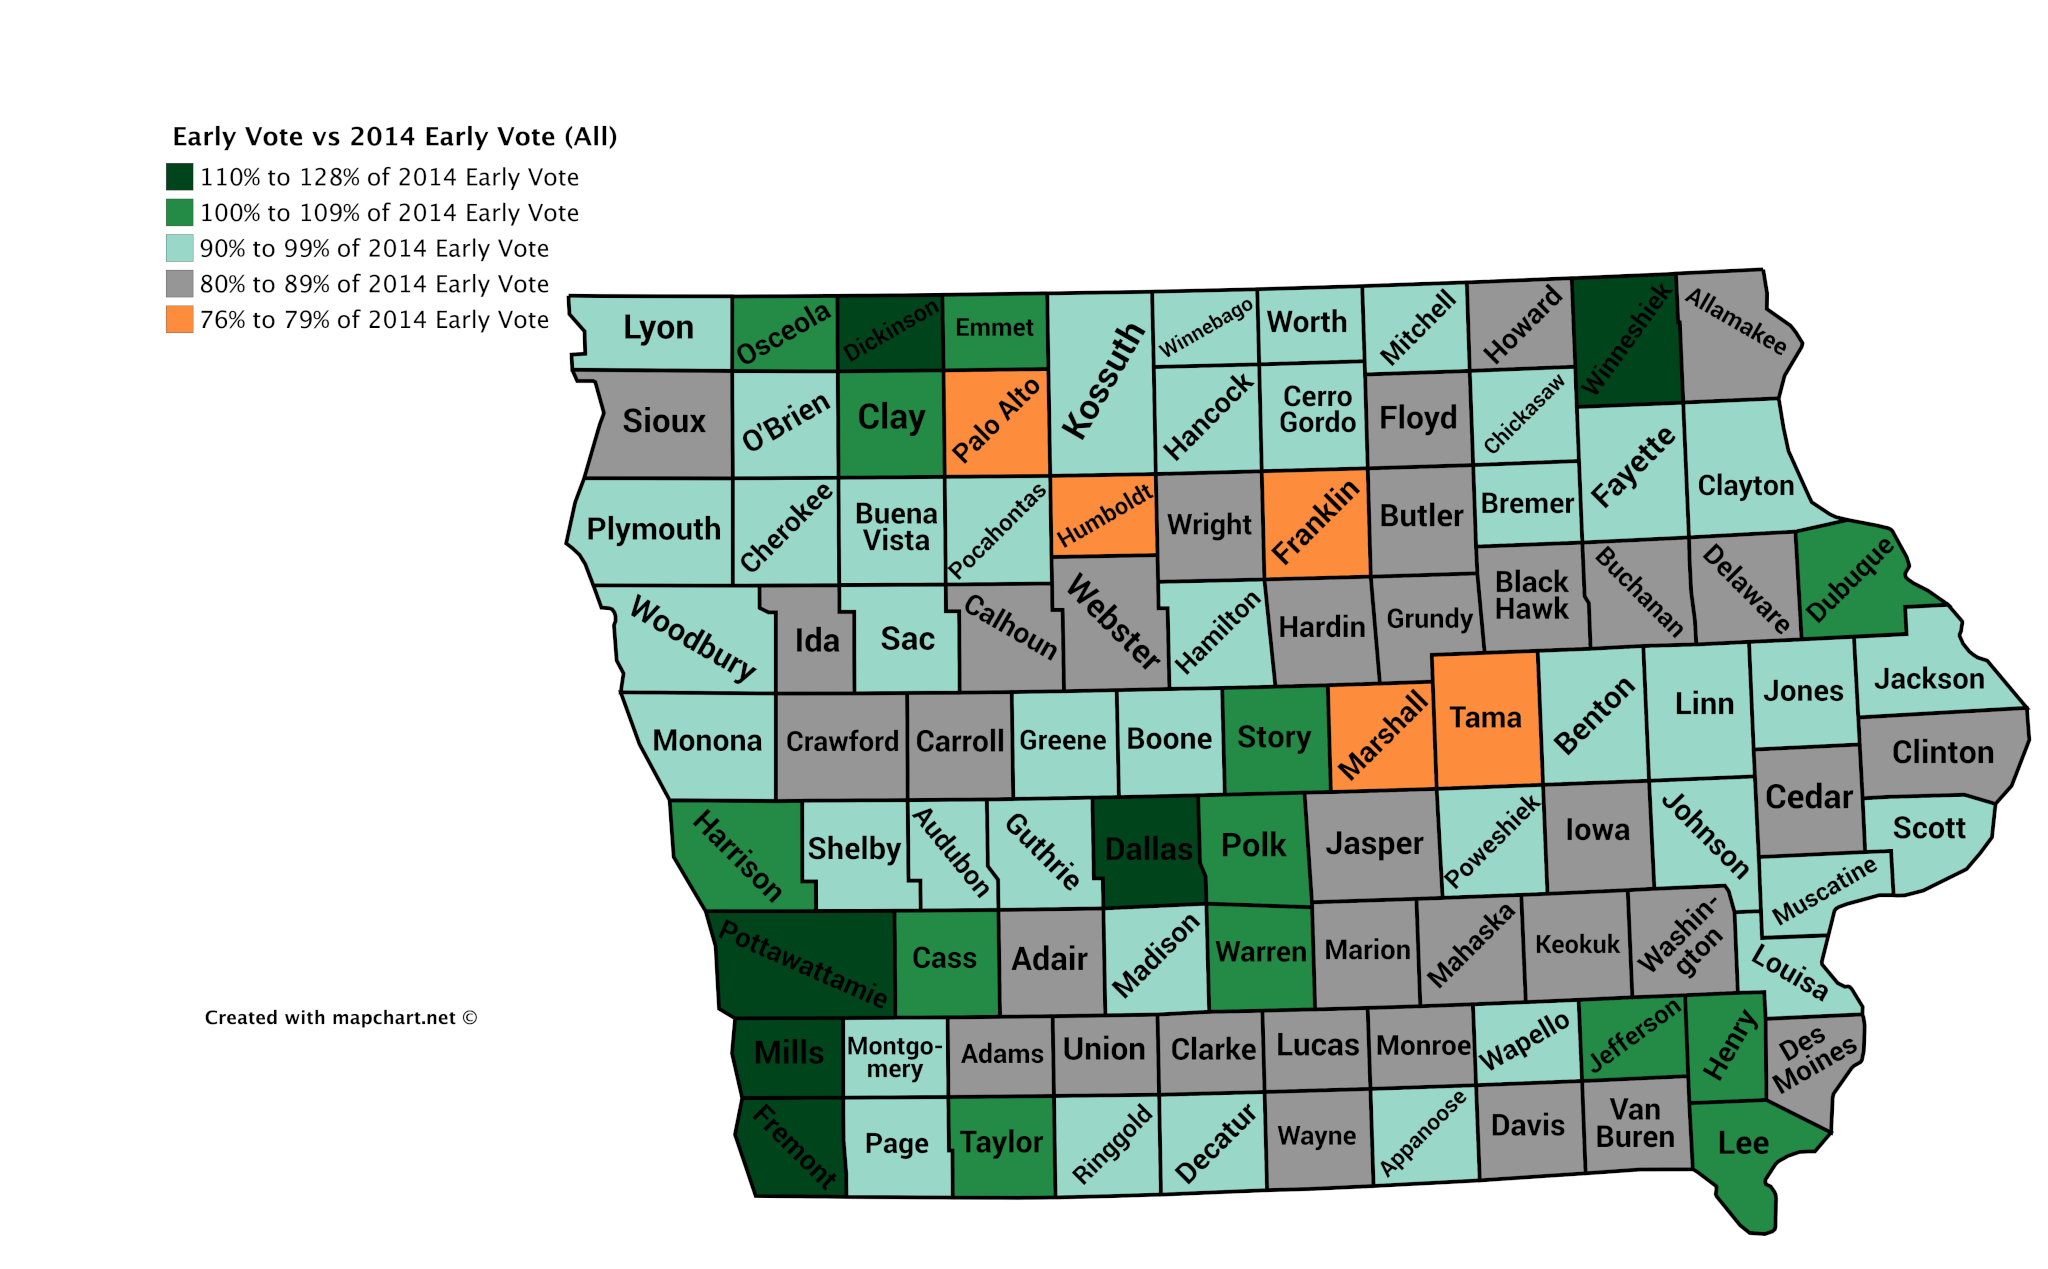
And here’s a map of where you can visualize those turnouts. The two darker green colors are counties that have already surpassed their 2014 early vote. The light green counties are in the 90% to 99% range, meaning they’re almost certain to get there. Those in the 80 to 89% may or may not depending on how many requests remain out there, and the orange ones have really fallen behind.
Of course, what you’re probably wondering is which parties are driving those numbers and where are Democrats and Republicans doing best.
For that, let’s first look at the Democrats. They have 39 counties where registered Democrats have already cast more ballots than they did in 2014. Republicans only have 14 counties where that’s the case.

Here’s the top Democratic counties. I’ll list out the 14 that are over 110% of the final 2014 early vote:
| County | Dem |
| Mills | 160% |
| Dallas | 155% |
| Dickinson | 132% |
| Montgomery | 128% |
| Jefferson | 126% |
| Winneshiek | 125% |
| Story | 122% |
| Pottawattamie | 121% |
| Polk | 119% |
| Fremont | 116% |
| Henry | 115% |
| Johnson | 113% |
| Dubuque | 112% |
| Cass | 111% |
And here’s the map for that. Again, the darkest two colors mean they’ve already surpassed 2014, while the lighter blue means they’ll almost certainly do so before Election Day.
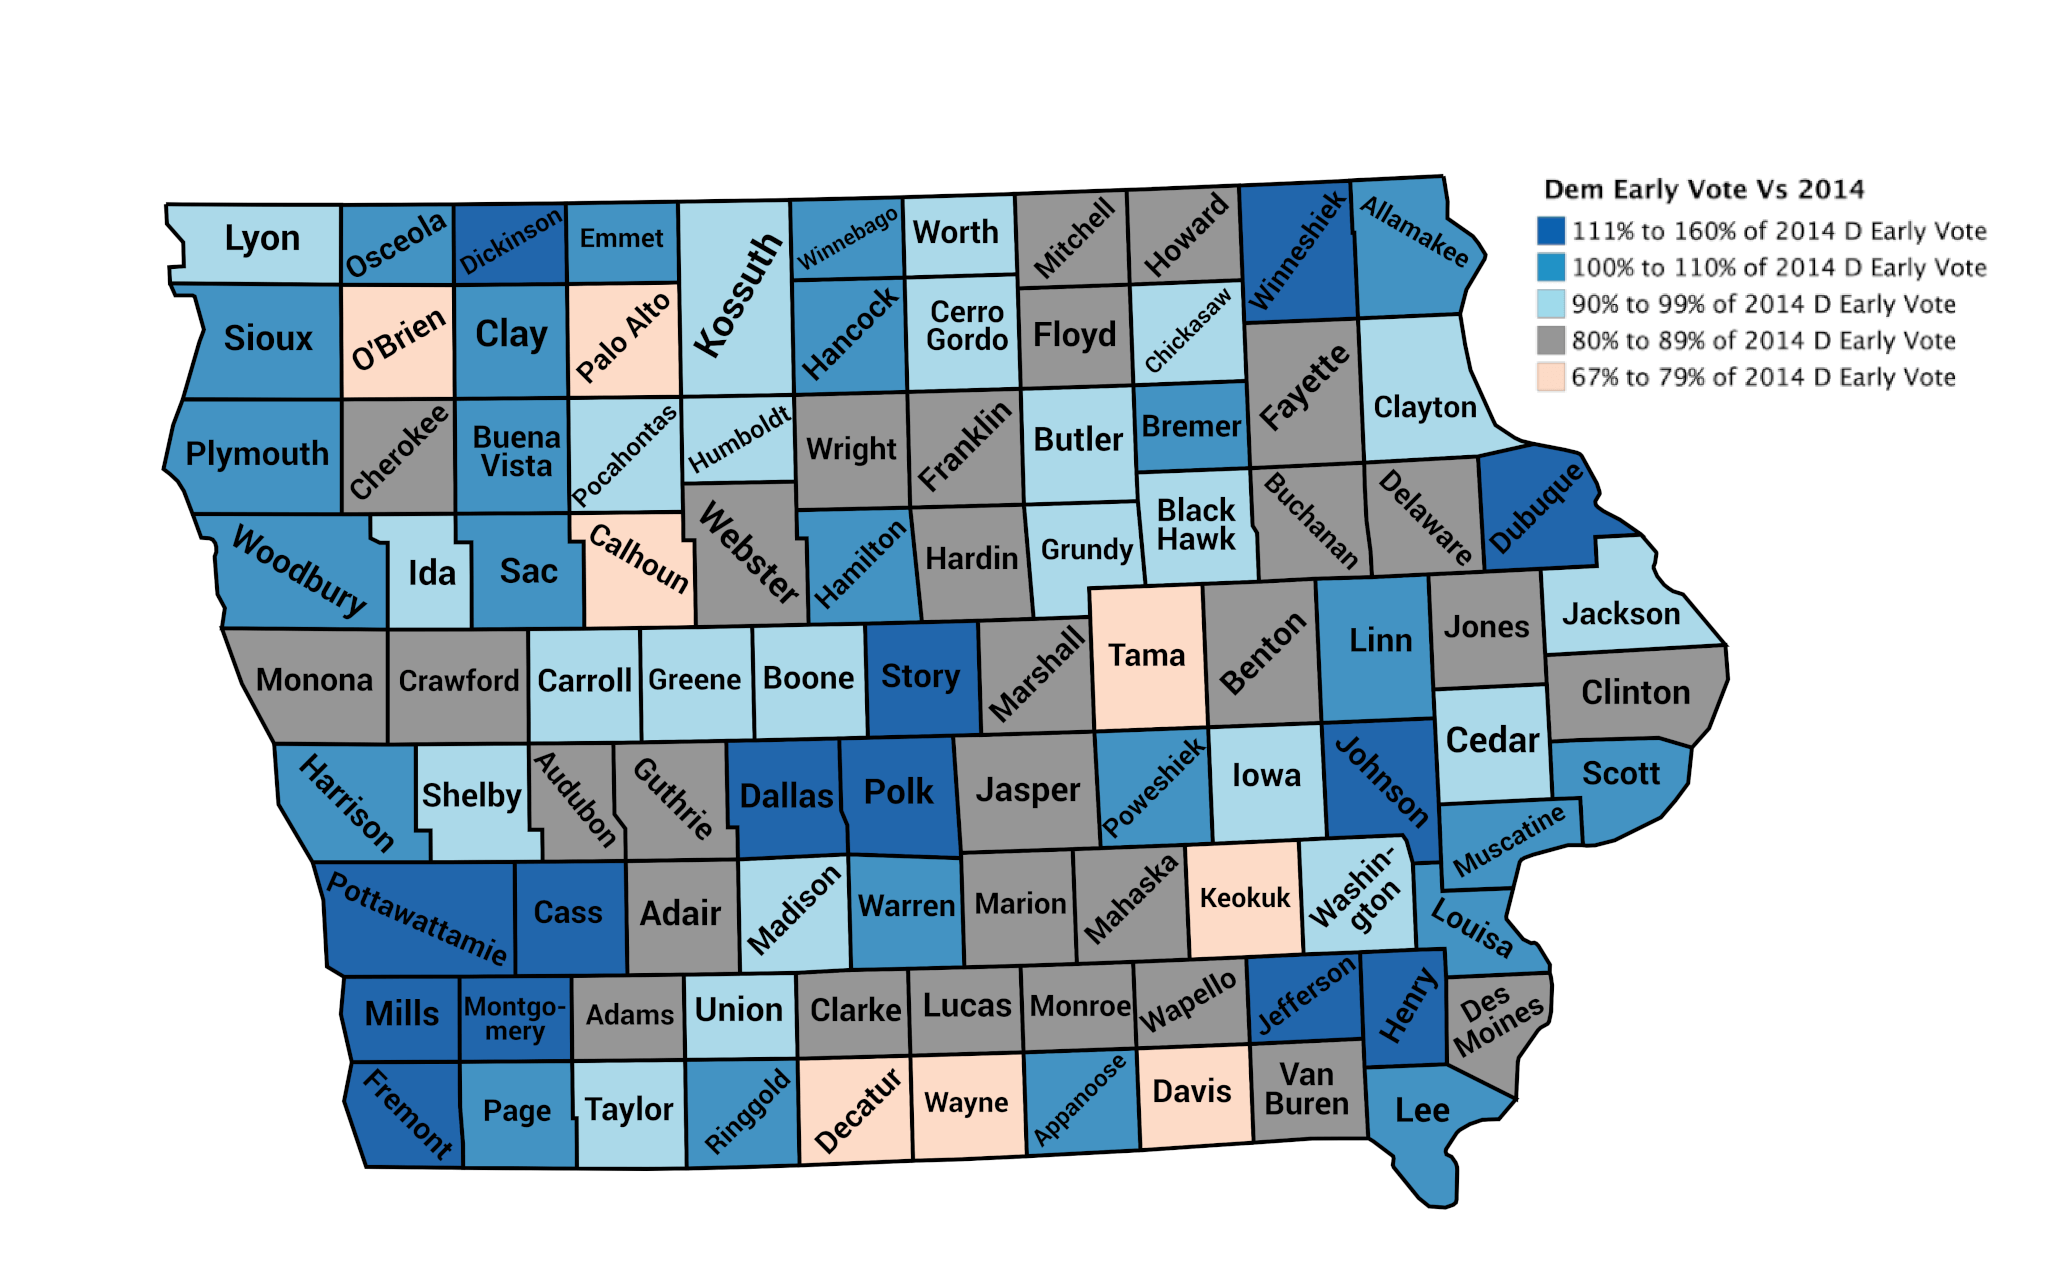
With the exception of Black Hawk County, all of the state’s largest counties have already beat their 2014 early vote numbers. That’s important to putting together big leads in the urban centers to carry the statewide ticket.
This map looks extremely good for Cindy Axne and the 3rd District. Those impressive early vote turnouts should keep David Young’s winning margins in the rural counties and Pottawattamie County down a bit. And with Dallas County putting up massive early vote numbers this year, the once-Republican stronghold could actually fall to Democrats. It’s difficult for Republicans to put together a win in the 3rd District if they can’t rack up a big margin in Dallas County and the western rural counties to overcome Polk County.

Northwest Iowa has several good clusters of Democratic turnout, which could be the extra boost J.D. Scholten needs in his bid to upset Steve King.
We’ll get into a legislative race round-up later, but the huge turnouts in Winneshiek and Jefferson will be good for Kayla Koether and Mary Stewart, respectively.
The only problematic areas are again that south-central portion of the state, but at least there’s not many targeted local races there for Democrats. And most of those are contained to the 2nd District, where Dave Loebsack faces an easy reelection.
One big concern for Democrats is the Mississippi River counties, a place where they’ve lost ground during the Trump era. Some of them are turning out well, some not so much.
How about the Republicans? Here’s the 14 counties in which they have surpassed their 2014 early vote totals:
| County | GOP |
| Fremont | 134% |
| Dickinson | 118% |
| Mills | 118% |
| Decatur | 117% |
| Lee | 107% |
| Taylor | 105% |
| Clay | 105% |
| Cass | 104% |
| Pocahontas | 104% |
| Audubon | 104% |
| Monona | 103% |
| Wapello | 102% |
| Cherokee | 101% |
| Dallas | 100% |
And here’s the map for that. Red is good in this situation; brown bad.
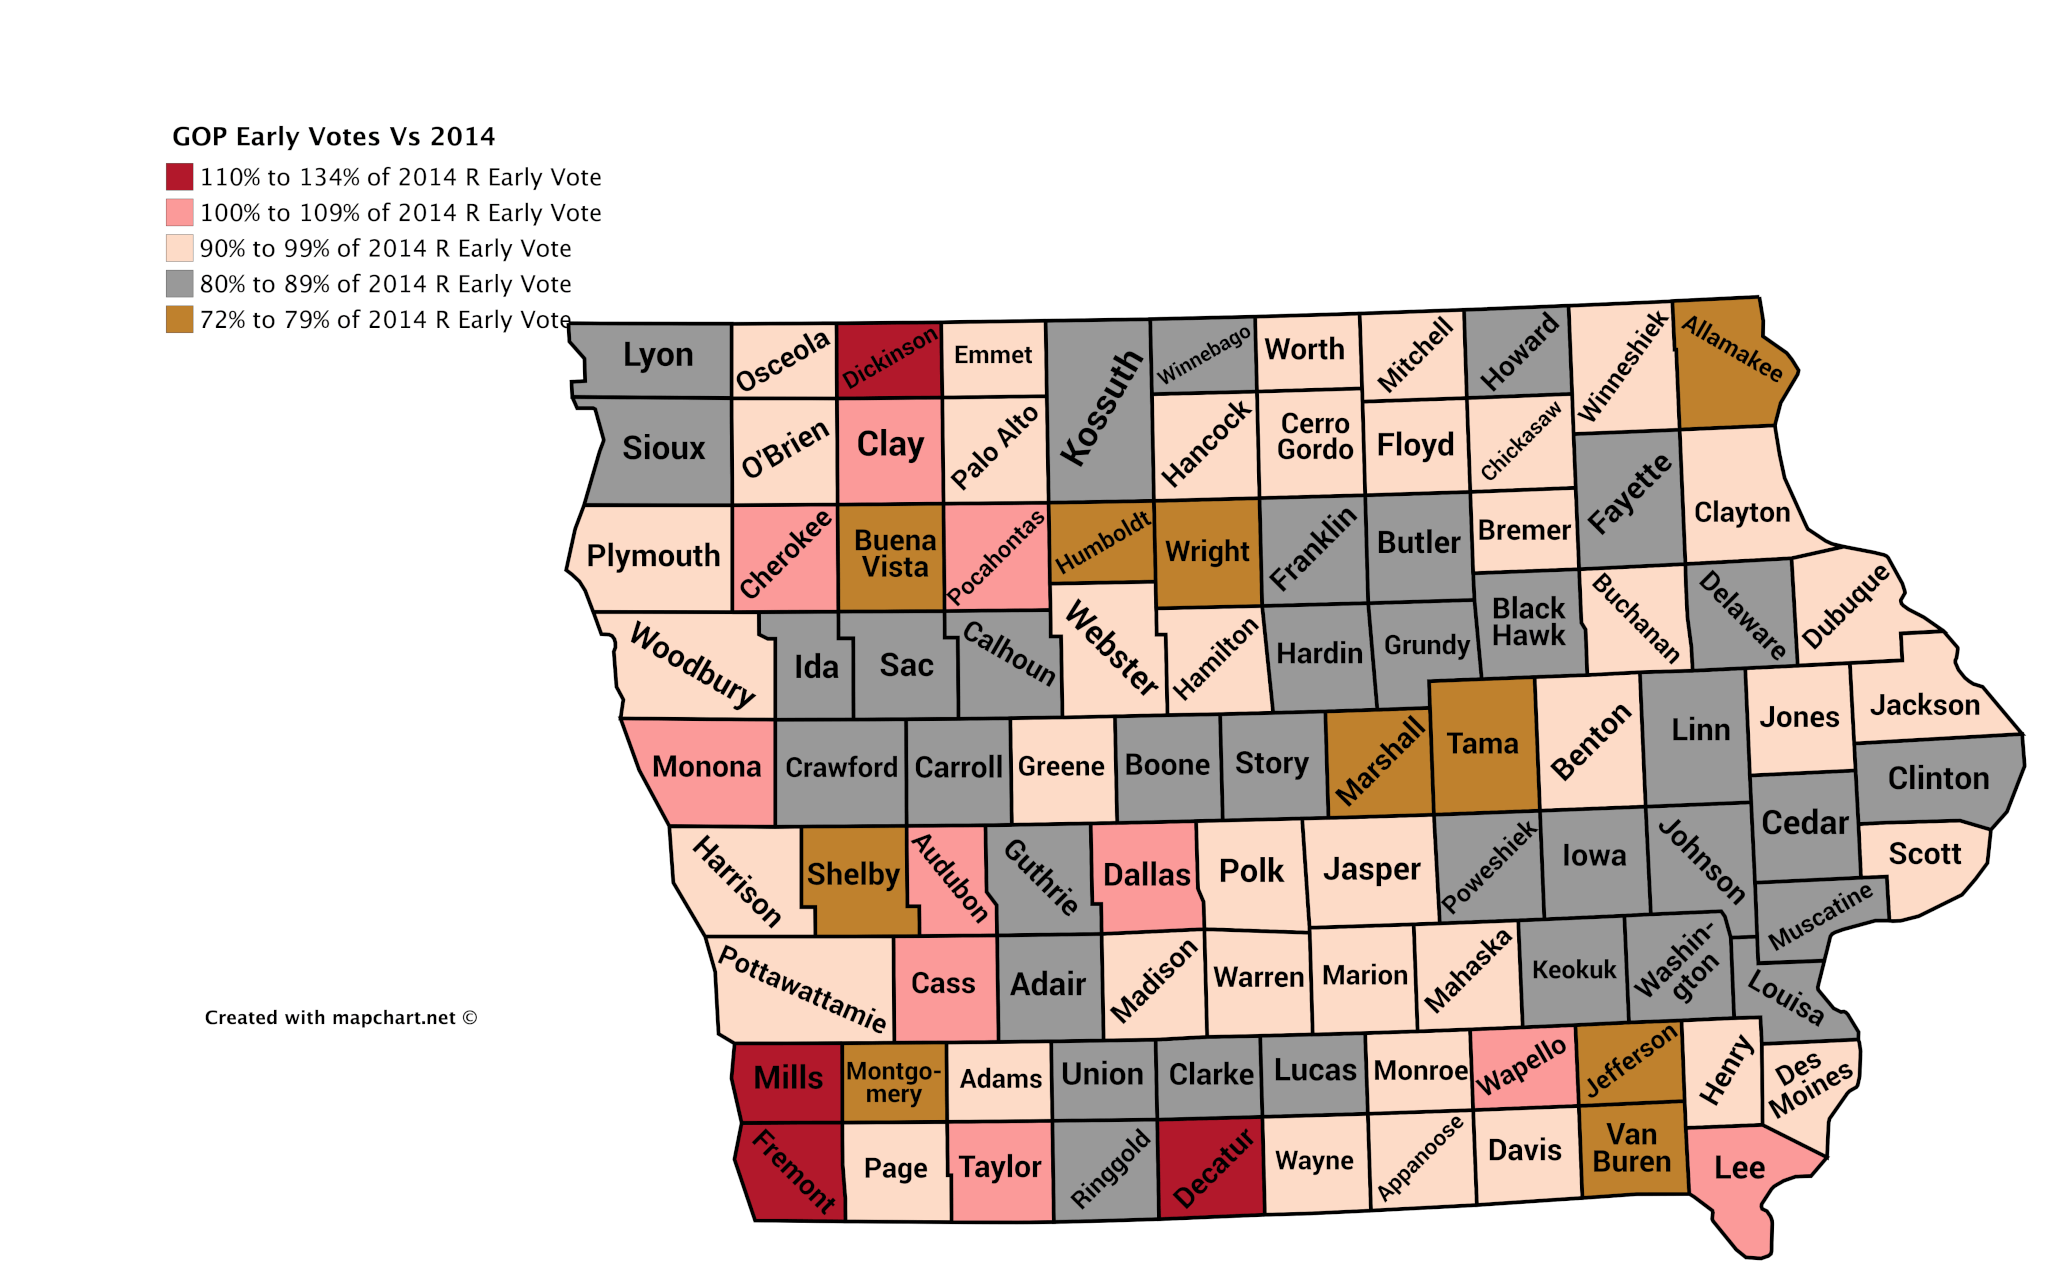
There aren’t as many clear trends here for Republicans as there were for Democrats. Southwest Iowa is also doing pretty well for them, as are pockets in Northwest Iowa. The eastern part of the state barely has any counties that have already broken their 2014 totals.
The thing that would concern me here is how several of the urban counties are lagging behind for Republicans. Kim Reynolds clearly won’t win Linn or Johnson counties, but you still want to see your Republican voters there show up to keep the margins closer. And Scott County is typically a bright spot for Republicans, but their early vote numbers are in the middle of the pack this year.
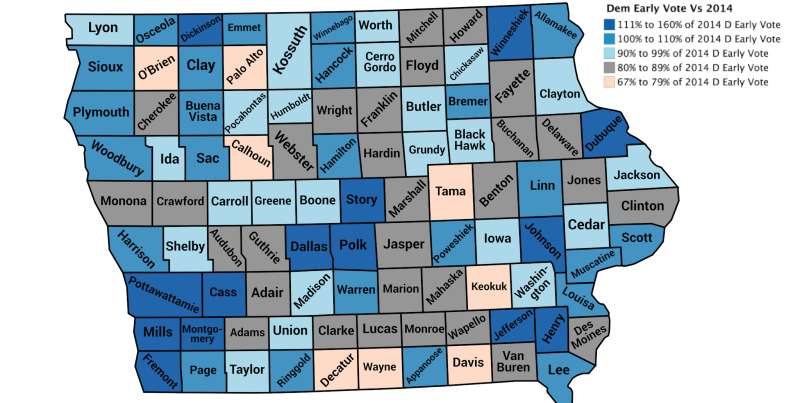
Now I want to try looking at one more number that might be illuminating. That’s the difference between the Democratic percentage of their final 2014 numbers and the Republican one.
For example, Democrats are at 122% of their final 2014 early vote totals in Story County. Republicans are at 82% of their final 2014 total. That’s a 40-point difference in favor of Democrats. I want to use this number to see where the Democratic base is not only turning out well, but turning out way better than Republicans (and vice versa).
You might call this the enthusiasm gap measurer, but I’m not sure if that’s a completely fair way to frame it. For example, Republicans are at 134% of their 2014 final total in Fremont County, while Democrats are at 116%. That’s an 18-point advantage for Republicans, but really, both sides are doing really well here.
You can only control your own numbers, so keep that in mind when you look at these differences in percentages. You may want to consult the full spreadsheet to better inform you on this.
That being said, there are some pretty interesting and clear trends here. Let’s start with the 17 counties where Democrats’ early vote percentages are 20 points or better than Republicans:
| County | Diff |
| Dallas | 55% |
| Montgomery | 50% |
| Jefferson | 49% |
| Mills | 42% |
| Story | 40% |
| Winneshiek | 34% |
| Johnson | 33% |
| Allamakee | 28% |
| Polk | 28% |
| Sioux | 26% |
| Ringgold | 24% |
| Poweshiek | 23% |
| Linn | 23% |
| Pottawattamie | 22% |
| Humboldt | 21% |
| Louisa | 20% |
And here’s the 15 counties where Republicans’ percentages are 10 points or more better than Democrats:
| Adams | -11% |
| Mahaska | -12% |
| Monroe | -12% |
| Wapello | -13% |
| Keokuk | -13% |
| Wayne | -13% |
| Taylor | -15% |
| O’Brien | -15% |
| Audubon | -17% |
| Fremont | -18% |
| Monona | -18% |
| Cherokee | -19% |
| Davis | -23% |
| Palo Alto | -30% |
| Decatur | -40% |
To better understand, here’s the map:
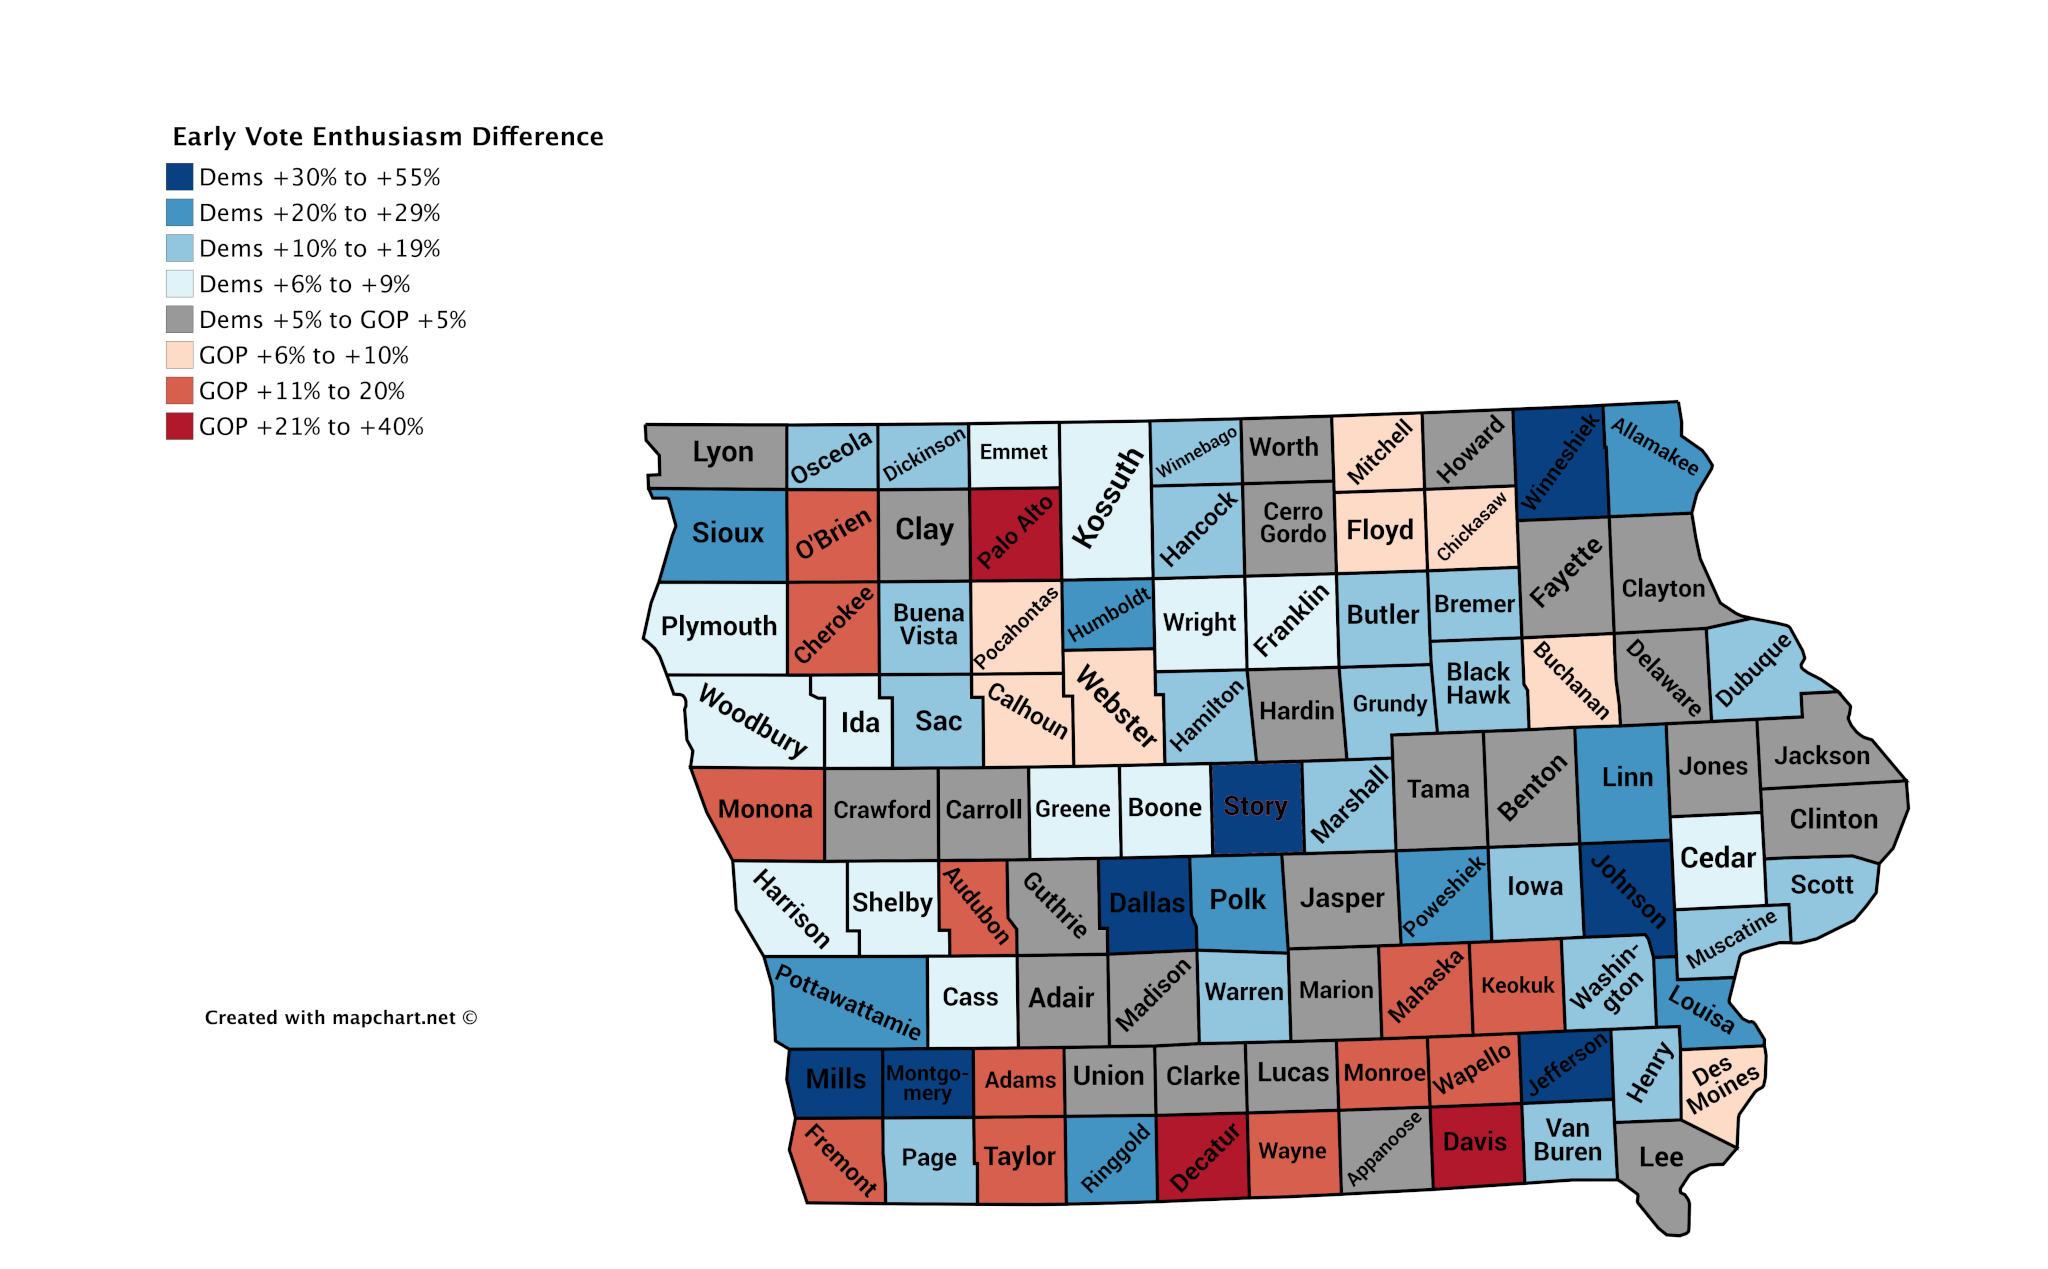
With this map, it seems clear that Republicans are much more motivated along that southern tier of Iowa counties, though Democrats are still doing well in that southwest corner. Republicans have a few nice pockets around the Fort Dodge area and Northern Iowa. They made big inroads into Des Moines County (home of Burlington) in 2016, and that’s a bright spot for them again.
But much of this map points to why Democrats could run up big margins in the places they need to. The counties with large percentages of highly-educated residents, like Johnson, Story, Dallas and Polk, all have Democrats vastly out-performing the Republicans.
A 55-point difference in early vote percentages to 2014 is just ridiculous for Dallas County. That’s going to give Republicans problems in a whole lot of important races this year and in the campaign cycles to come.
by Pat Rynard
Posted 11/3/18