Iowa, it’s finally here.
Early voting for the 2020 election officially kicked off this morning, with county auditor offices across the state opening for early in-person voting. Meanwhile, those same election offices were sending out trucks and vans filled with absentee ballots to post offices.
There’s a lot of ballots to deliver. As of Friday evening, over 630,000 Iowans had requested an absentee ballot. In 2016, just under 650,000 Iowans voted early. To have nearly that many already requesting a ballot a month out from the election, the early vote this year will blow past all kinds of records.
Just like Starting Line does every year, we’ll be taking a close look at where those early votes are coming from and how they compare to past cycles. There’s always little clues that can show where each party is doing particularly well or is struggling to turn out their base.
This year, however, is a lot more complicated with the pandemic. I spent much of the weekend pouring over the numbers, entering in results for every county and lining those up with data from 2016.
In most election years, I compare the current requests or votes to how many ballots had been requested or votes cast at this same point in the cycle four years ago. That gives us a sense of which counties or local parties are on track to surpass or underperform their turnout from the last comparable election. The pandemic jumbles all that this year, as well as Republicans shortening the early vote window, so the timeline doesn’t match up the same way.
[inline-ad id=”0″]
Still, there’s lots of different metrics we can compare and theorize about what they mean. As always, I’m making my spreadsheets publicly available so you can play around with them too.
Let’s start with the most straightforward: the party breakdown of absentee requests.
Registered Democrats have, as of Friday evening, requested far more absentee ballots than registered Republicans. Democrats account for 53% of the total requests so far, with Republicans making up 30%.
| Requests | % Of Total | |
| Dem | 335,350 | 53% |
| GOP | 186,995 | 30% |
| NP | 108,139 | 17% |
| Total | 630,484 |
(Of note: As I’m mostly focusing on Democratic and Republican numbers for this story, I’m not including the “Other” party requests — Green or Libertarian, mostly — as they make up less than half a percent and would require a lot more data entry.)
We’re going to be looking at most of these numbers by county. The statewide county map in this situation looks a lot better for Democrats than final results in recent elections, with Democratic requests outpacing Republican ones in 66 of Iowa’s 99 counties.
 For each of these maps, I’ll try to be clear in what they show. For example, in the above, Carroll County is blue because Democrats have the advantage in absentee requests there — 1,811 requested compared to Republicans’ 1,248. Democrats there have requested 47.5% of the ballots in Carroll County, compared to 32.7% for Republicans, giving them a 14.8-point advantage, which is how the counties are shaded.
[inline-ad id=”1″]
Here’s the top ten counties for Democrats:
| County | Diff |
| Johnson | 55.8% |
| Jefferson | 42.3% |
| Story | 38.8% |
| Wapello | 37.8% |
| Polk | 37.6% |
| Dubuque | 37.5% |
| Lee | 36.1% |
| Linn | 35.7% |
| Des Moines | 35.7% |
| Jackson | 30.3% |
And here’s the ten best for Republicans:
| County | Diff |
| Lyon | -60.9% |
| Sioux | -56.7% |
| Osceola | -46.5% |
| O’Brien | -36.5% |
| Page | -23.5% |
| Plymouth | -22.0% |
| Sac | -20.4% |
| Cherokee | -20.2% |
| Montgomery | -18.3% |
| Ida | -16.9% |
Now, Democrats overall always vote early in higher numbers than Republicans. There were 265,597 early votes from registered Democrats in 2016 and 224,556 from Republicans. And Democrats usually start out with a very large absentee request advantage before early voting starts, then Republicans narrow that margin down.
This year could be different.
Voters have already seen a barrage of absentee ballot requests, including the official statewide one from the Secretary of State. If Republican voters haven’t signed up for one by now, is there going to be some major change in the next few weeks where they catch up with Democrats like in past years? Especially when their President is discouraging voting by mail? Perhaps a disproportionate number of Republicans will now vote early in person, and the margin will decrease that way, but the impact could be minimal.
[inline-ad id=”2″]
Despite narrowing margins in the past, I would be very happy as a Democrat with the absentee request numbers we’re seeing right now. One week ago, Democrats made up 55% of the early vote requests and Republicans 29%. The margin has only moved 3 points in Republicans’ favor in that time. It seems Democrats could maintain a very large early vote lead through Election Day.
Now let’s look at how counties overall are doing with early vote requests.
Here’s a map that compares the current absentee ballot requests to the total final vote (both early and Election Day) in the 2016 election:
 Let’s take one county to explain. In Pottawattamie County, there are currently 20,220 absentee requests total from Democrats, Republicans and No Party voters. Back in 2016, there were 42,689 total votes from those groups. That means that 47% of the people who voted in the 2016 election have already requested to vote early this year (not necessarily the exact same people, but you get the point). Meanwhile, in Worth County, the current requests are only 27% of Worth’s total vote in 2016.
[inline-ad id=”3″]
Impressively, Johnson County already has half the number of early vote requests as total votes in 2016.
The higher these numbers are, the more likely it is for turnout in 2020 to surpass the county’s turnout in 2016.
Here’s the top 15 counties:
| County | 2016 Total % |
| Johnson | 50% |
| Polk | 49% |
| Clinton | 48% |
| Dallas | 47% |
| Pottawattamie | 47% |
| Dubuque | 46% |
| Poweshiek | 44% |
| Woodbury | 44% |
| Black Hawk | 44% |
| Winneshiek | 43% |
| Scott | 43% |
| Warren | 42% |
| Fayette | 42% |
| Linn | 42% |
And the bottom 15 counties:
| County | 2016 Total % |
| Van Buren | 23% |
| Taylor | 24% |
| Monona | 25% |
| Decatur | 26% |
| Osceola | 26% |
| Sioux | 27% |
| Worth | 27% |
| Emmet | 27% |
| Tama | 28% |
| Keokuk | 28% |
| Cass | 28% |
| Hancock | 28% |
| Ringgold | 28% |
| Monroe | 28% |
This doesn’t tell the whole story, though, so let’s also compare current requests to the early vote numbers from 2016. Why? Because some counties always have really high early vote numbers. What we can also see is which counties are voting early in far higher numbers this year than usual.

These numbers show how massive the early vote is going to be in some places compared to four years ago. There are 20 counties that have already surpassed their 2016 early vote with current requests.
Those are:
| County | Percent |
| Polk | 128% |
| Fayette | 118% |
| Linn | 114% |
| Dallas | 114% |
| Pottawattamie | 113% |
| Harrison | 109% |
| Grundy | 108% |
| Black Hawk | 107% |
| Lyon | 106% |
| Sac | 105% |
| Clayton | 104% |
| Clinton | 102% |
| O’Brien | 102% |
| Dubuque | 101% |
| Page | 101% |
| Iowa | 101% |
| Winnebago | 101% |
| Jones | 100% |
| Cedar | 100% |
| Butler | 100% |
To be clear, these are requests at this point, not actual votes, but this many requests still point to higher turnout.
As you can see, Polk County is going to blow the doors off their 2016 early vote numbers, likely also pointing to an overall increase in turnout.
These numbers also have good news for some other counties. Let’s take Van Buren County here as an example. Though they’re dead last on the previous map as percent of total 2016 turnout, here we can see that their current requests are already at 90% of their 2016 early vote. That means that their early vote should be decently up this year, even if it still won’t make up most of their final vote. Same for the Northwest Iowa corner — they don’t often have high early vote numbers, but they’re still improving a lot this year.
[inline-ad id=”4″]
The caveat with this map is you shouldn’t be concerned if you’re Winneshiek County here — their early vote numbers are always so high that it’s hard to improve any more. And in the previous map, they’re doing quite well in terms of current requests as a percentage of total 2016 vote.
You should be concerned, however, if your county is low on both of these maps/lists (looking at you, Clay County). That means that you typically have lower early vote numbers and they’re not improving any this year. That’s a big warning sign.
Now let’s go back to partisan breakdowns. Each party is always going to have an advantage in some counties — the other question here is whether their numbers are improving over past years. Democrats aren’t going to win Page County anytime soon — but if they improve from 33% of the vote to 40% of the vote, that’s a success, right?
So, here is current Democratic requests as a percentage of the total Democratic voter turnout in 2016:
 Again, for example, there were 7,697 registered Democrats who voted in Warren County in 2016. Currently, there are 5,890 registered Warren County Democrats who have requested an absentee ballot. That means that 74% of Democrats’ 2016 turnout in Warren County already have a ballot coming to them. That’s pretty good!
And here’s the top 15 counties on that metric:
| County | Dem Total |
| Dallas | 94% |
| Page | 80% |
| Washington | 75% |
| Pottawattamie | 74% |
| Warren | 74% |
| Montgomery | 74% |
| Winneshiek | 73% |
| Grundy | 73% |
| Polk | 73% |
| Allamakee | 73% |
| Dickinson | 72% |
| Clinton | 71% |
| Hardin | 70% |
| Scott | 70% |
| Johnson | 69% |
These are very encouraging numbers for Democrats. In Clinton County, they already have 71% of their total turnout from 2016 signed up to vote early. Imagine going into Election Day and 70% to 90% of your base voters from the last presidential election have already voted!
Now here’s the bottom 15 counties for Democrats:
| County | Dem Total |
| Ringgold | 40% |
| Van Buren | 40% |
| Davis | 41% |
| Monona | 42% |
| Keokuk | 42% |
| Monroe | 45% |
| Palo Alto | 46% |
| Decatur | 46% |
| Clarke | 46% |
| Tama | 47% |
| Emmet | 48% |
| Taylor | 48% |
| Wapello | 50% |
| Buena | 50% |
| Howard | 51% |
[inline-ad id=”5″]
Just like in the previous set of maps, however, you should also take into consideration whether a county’s voters just disproportionately vote at the polls. An increase in the percentage number of early votes is still good news for them.
Here’s what that map looks like:
 And here’s the top 15 counties for current requests as a percentage of their 2016 early vote:
| County | Dem Early |
| O’Brien | 181% |
| Butler | 175% |
| Dallas | 172% |
| Grundy | 170% |
| Hancock | 167% |
| Montgomery | 162% |
| Sac | 161% |
| Sioux | 161% |
| Winnebago | 160% |
| Harrison | 159% |
| Lyon | 157% |
| Osceola | 156% |
| Fayette | 153% |
| Page | 152% |
| Polk | 147% |
This list is pretty ridiculous. O’Brien County has nearly twice the number of Democrats requesting to vote early than did so in 2016. Dallas County’s Democratic turnout is going to destroy past records (it helps that it’s the fastest-growing county, but that’s not the only reason). Polk County’s 147% number is very impressive considering just how many votes that represents in the state’s most populous county.
Now here are the bottom 15 counties:
| County | Dem Early |
| Ringgold | 85% |
| Jefferson | 89% |
| Davis | 92% |
| Palo Alto | 93% |
| Monroe | 93% |
| Clarke | 94% |
| Buena | 97% |
| Cherokee | 98% |
| Marshall | 98% |
| Union | 99% |
| Lee | 103% |
| Wapello | 103% |
| Jasper | 103% |
| Winneshiek | 104% |
| Floyd | 105% |
It’s clear that Democrats in every single county are going to surpass their 2016 early vote numbers, even in those lagging a bit right now.
Like in the overall turnout, here’s how you should look at your county from these two maps:
- If your county is high on both lists, you’re doing spectacular and Democratic turnout is likely to spike.
- If your county is low on one list but high on the other, you’re still doing pretty good.
- If your county is low on both lists, you have a concerning turnout problem.
[inline-ad id=”6″]
Okay, how about the Republicans?
Here’s the map of how Republicans’ current absentee requests stack up against their final total vote in 2016.
 For example, Tama County saw 3,058 registered Republicans turn out to vote in 2016. Right now, 750 Republicans in Tama County have requested an absentee ballot, or 25% of their total 2016 vote.
While we’ll see that Republicans have improved their early vote requests in most places, you can also see why this might still be concerning for their party.
Here’s their top 15 counties:
| County | GOP Total |
| Clinton | 47% |
| Woodbury | 43% |
| Pottawattamie | 43% |
| Jackson | 42% |
| Lee | 42% |
| Crawford | 41% |
| Dubuque | 41% |
| Black Hawk | 40% |
| Kossuth | 40% |
| Fayette | 39% |
| Union | 39% |
| Poweshiek | 37% |
| Palo Alto | 37% |
| Dallas | 36% |
| Winneshiek | 36% |
And their bottom 15 counties:
| County | GOP Total |
| Decatur | 19% |
| Taylor | 21% |
| Worth | 23% |
| Van Buren | 23% |
| Clay | 23% |
| Cass | 23% |
| Benton | 24% |
| Story | 25% |
| Tama | 25% |
| Monona | 25% |
| Audubon | 25% |
| Cerro Gordo | 25% |
| Wayne | 25% |
| Lucas | 26% |
| Winnebago | 26% |
Those top counties are doing well, but in a lot of places, Republicans may still be looking at having to turn out 60% to 70% of their 2016 base on Election Day itself… in the middle of a pandemic. What if COVID-19 cases spike in a county right around Nov. 3? What if Trump worsens his prospects even more by then?
If there was ever a year where you wanted to get your base vote locked in early, it’s 2020.
[signup_form]
That being said, Republicans have significantly improved their early vote numbers in some counties across Iowa.
Here’s Republican current requests as a percentage of their total 2016 early vote:
 So for example, in Lee County, 1,700 registered Republicans voted early in 2016. This year, 1,626 Republicans have already requested a ballot, or 96% of that 2016 number.
Here’s the best 15 GOP counties:
| County | GOP Early |
| Fayette | 110% |
| Sac | 108% |
| Lyon | 107% |
| Clinton | 107% |
| Pottawattamie | 103% |
| Harrison | 100% |
| Black Hawk | 100% |
| Kossuth | 100% |
| Polk | 99% |
| Jackson | 97% |
| Osceola | 97% |
| Iowa | 97% |
| Grundy | 97% |
| Carroll | 96% |
| Woodbury | 96% |
And the worst:
| County | GOP Early |
| Clay | 51% |
| Audubon | 59% |
| Decatur | 60% |
| Cerro Gordo | 60% |
| Lucas | 60% |
| Mills | 62% |
| Madison | 62% |
| Dickinson | 63% |
| Mahaska | 63% |
| Wapello | 63% |
| Henry | 63% |
| Jefferson | 64% |
| Cass | 65% |
| Monroe | 65% |
| Marshall | 67% |
So, you can see that Republicans are going to do well in surpassing their early vote totals from 2016, especially in some Eastern Iowa counties. But their best percentages — 110% in Fayette, 108% in Sac — don’t compare to Democrats’ best — 181% in O’Brien, 175% in Butler. Democrats, despite already voting early at higher numbers than Republicans, are somehow boosting those numbers at a much higher percentage than the GOP.
And in Democrats’ worst counties, their early vote for 2020 may only be slightly ahead of their 2016 numbers. In Republicans’ worst counties, they may actually have a lower early vote turnout this year… in the middle of a pandemic. That’s… kinda odd. But when you have a President who actively discourages people from voting early, I suppose that’s the result.
[inline-ad id=”7″]
Finally, here’s some takeaways from the county numbers:
Biggest concern for Democrats: Several of the more diverse counties are low on both lists for Democrats — Buena Vista, Crawford and Marshall counties. Buena Vista is especially bad, with only 50% of its 2016 vote and 97% of its 2016 early vote requested. I would be worried that the lack of door-knocking during the pandemic has hurt Democrats’ ability to sign up voters in diverse communities in some counties.
Polk and Dallas to dominate: Yes, there’s been population growth in the Des Moines metro. But it’s helping Democrats at a far higher rate than Republicans. Dallas County Democrats nearly have their entire 2016 turnout signed up for the early vote (94%). That’s good for an 172% increase in early vote a month out. Dallas County Republicans, meanwhile, have just over a third (36%) of their 2016 base ready to vote. Despite the population growth, Republican requests are also only at 85% of their 2016 early vote.
Democrats have about three-fourths (73%) of their 2016 vote signed up to vote early in Polk County. Republicans have just a third (33%).
Southwest Iowa corner good for Democrats: Following up their success in 2018, the local Democratic parties in the southwest corner of Montgomery, Page and Fremont are doing great work again this year. That’s important for Cindy Axne’s race, as David Young is counting on higher margins than 2018 in rural counties to win.
Southeast Iowa corner good for Republicans: Though Democrats far outpace them on the overall request breakdown, Republicans are improving significantly on their 2016 numbers in Lee and Des Moines counties, while Democrats are not. Lee County is Republicans’ 16th-best county for percentage of their 2016 early vote, while it’s Democrats’ 11th worst.
Southern tier counties struggling: Hopefully the counties along Iowa’s southern central border show up at the polls, because most of them are really lagging on early vote requests — for both parties.
There’s other takeaways, but I’ll let the readers point them out in the comments section. And, as always, if you appreciate having these data sets public and organized, we always appreciate donations to Starting Line to keep us going.
by Pat Rynard
Posted 10/5/20
[inline-ad id=”1″]
Iowa Starting Line is an independently owned progressive news outlet devoted to providing unique, insightful coverage on Iowa news and politics. We need reader support to continue operating — please donate here. Follow us on Twitter and Facebook for more coverage.


Iowa Republicans make outlawing gay marriage key 2024 campaign priority
Iowa Republicans have made outlawing gay marriage a key goal in their 2024 party platform. During the Iowa GOP’s 2024 state convention on Saturday,...
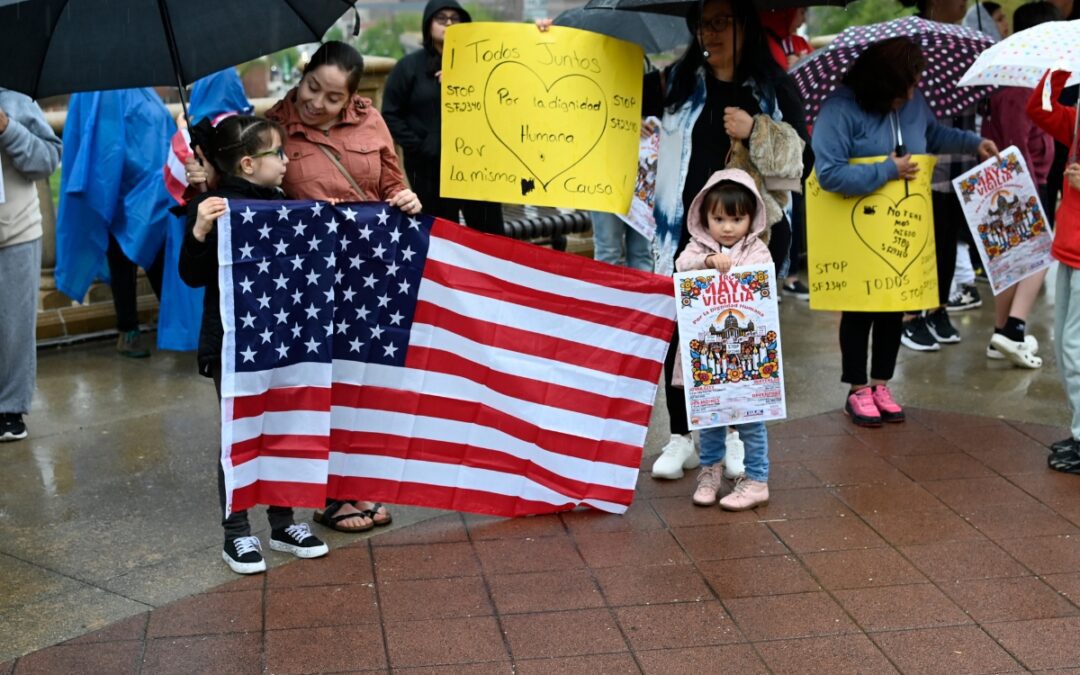
Department of Justice says Iowa immigration law violates US Constitution
If Iowa doesn’t suspend the enforcement of its new immigration law by May 7, the state could face a federal lawsuit, according to the Des Moines...
Rushing: Iowa State president said the quiet part out loud
I want to thank Iowa State University President Wendy Wintersteen for doing us all a favor by finally saying the quiet part out loud: all the...
Iowa sets aside almost $180 million for year two of voucher program
Iowa has committed nearly $180 million in taxpayer funds to support private school tuition in the 2024-25 school year, which is almost $50 million...
Kalbach: Immediate action needed on corporate ag pollution
Iowa agriculture has undergone substantial changes over the past 40 years. We see it all around us. Rather than crops and livestock being raised on...

VIDEO: Jochum calls Gov. Reynolds’ summer meal program a ‘hunger game’
Iowa Gov. Reynolds announced a competitive $900,000 grant program to feed Iowa children over the summer, months after she declined $29 million in...