Democrats were feeling good early on last night.
Cindy Axne and Abby Finkenauer had both made history in their congressional victories. J.D. Scholten was actually leading Steve King. Democrats swept a series of Iowa House races in the Des Moines suburbs. Fred Hubbell jumped out to a big lead when Polk County came in fast.
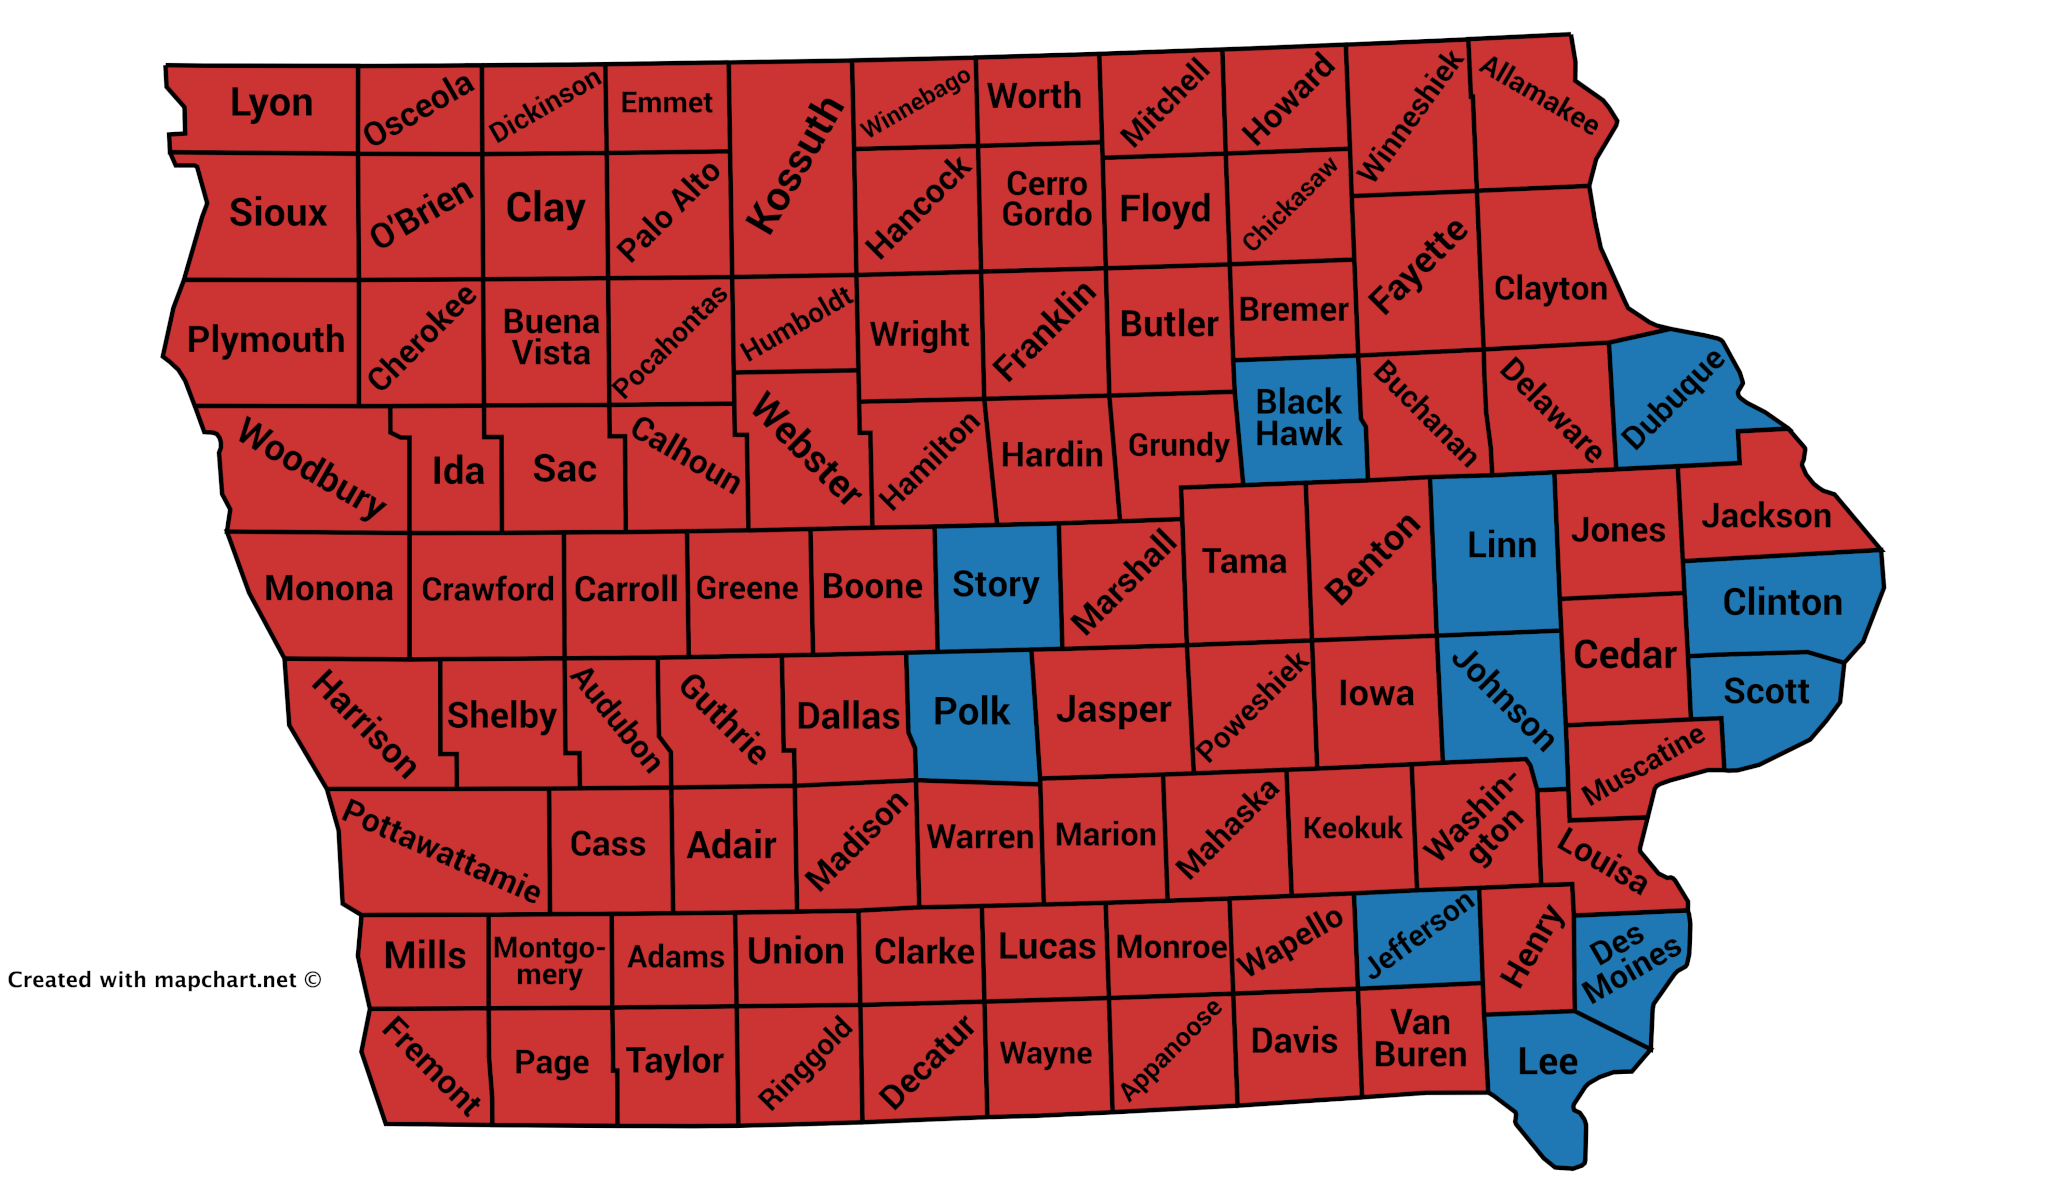
But as the evening wore on, the mood soured. Kim Reynolds picked up steam as rural counties reported, and she started winning a handful of blue-collar Eastern Iowa counties that Democrats needed to hold. Eventually, she won.
How?
Many Democrats were stunned that both Finkenauer and Axne could win hard-fought, competitive races and Hubbell would still lose. That would take a lot of split-ticket voting to produce that result.
And that’s exactly what happened. Starting Line will do deeper dives into all of these results, but let’s start off with a story about the most shocking number from election night: 88,777.
That’s the difference in the margin of votes cast in Democrats’ favor for the congressional races over the governor’s race.
Here’s how the votes broke down for each party’s congressional candidate in those races (these numbers are from the Secretary of State’s website as of Wednesday just before noon):
| Dem | GOP | |
| CD 1 | 169,348 | 152,940 |
| CD 2 | 171,054 | 133,010 |
| CD 3 | 169,886 | 164,656 |
| CD 4 | 146,698 | 157,221 |
| Total | 656,986 | 607,827 |
Abby Finkenauer, Dave Loebsack, Cindy Axne and J.D. Scholten combined for a 49,153 vote lead over the combined votes for Rod Blum, Chris Peters, David Young and Steve King.
Now here’s the final statewide totals for the governor’s race and how they compare:
| Hubbell | Reynolds | |
| Gov | 623,009 | 662,633 |
| Diff from Congressonal | -33,970 | 54,807 |
That’s a net swing of 88,777 votes to the Republicans from the congressionals to the gubernatorial.
Of course, for those following Iowa politics at all, that’s not necessarily a fair reflection on how Hubbell did. Peters had a poorly-funded campaign in the 2nd District, so Loebsack was always going to over-perform there (as he typically does). And King’s free-fall in the final weeks of the campaign meant that Scholten was likely to pick up way more votes in the 4th District than the rest of the ticket. The congressional candidates were pretty much certain to win more votes, but the final number is noteworthy.
What this does show is just how many ticket splitters were out there in Iowa this year for some of the biggest races. That’s fascinating, and has implications for lots of state races going forward.
I totaled up the specific county numbers in the 1st District to see the difference between Finkenauer and Hubbell. Since the 1st District was a tight contest between Finkenauer and Blum, that might reveal some interesting early trends.
Here’s their vote totals by county (if this doesn’t show up properly, you can view the spreadsheet online here):
| Blum | Finkenauer | Reynolds | Hubbell | Reynolds Diff | Hubbell Diff | |
| Allamakee | 3,069 | 2,346 | 3,321 | 2,160 | 252 | -186 |
| Benton | 6,460 | 4,696 | 6,839 | 4,481 | 379 | -215 |
| Black Hawk | 22,079 | 29,615 | 22,762 | 29,209 | 683 | -406 |
| Bremer | 5,893 | 5,159 | 6,205 | 4,981 | 312 | -178 |
| Buchanan | 4,164 | 3,972 | 4,397 | 3,862 | 233 | -110 |
| Clayton | 4,295 | 3,282 | 4,486 | 2,951 | 191 | -331 |
| Delaware | 4,472 | 2,805 | 4,775 | 2,663 | 303 | -142 |
| Dubuque | 19,257 | 22,318 | 21,068 | 20,503 | 1,811 | -1,815 |
| Fayette | 4,140 | 3,678 | 4,504 | 3,421 | 364 | -257 |
| Howard | 1,813 | 1,518 | 1,985 | 1,358 | 172 | -160 |
| Iowa | 4,185 | 3,087 | 4,483 | 2,950 | 298 | -137 |
| Jackson | 4,476 | 3,786 | 4,739 | 3,566 | 263 | -220 |
| Jones | 4,486 | 3,781 | 4,764 | 3,647 | 278 | -134 |
| Linn | 40,526 | 57,119 | 42,216 | 56,196 | 1,690 | -923 |
| Marshall | 7,121 | 6,606 | 7,240 | 7,090 | 119 | 484 |
| Mitchell | 2,505 | 1,827 | 2,699 | 1,696 | 194 | -131 |
| Poweshiek | 4,034 | 3,933 | 4,148 | 3,966 | 114 | 33 |
| Tama | 3,743 | 3,201 | 3,893 | 3,183 | 150 | -18 |
| Winneshiek | 4,360 | 5,092 | 4,835 | 4,777 | 475 | -315 |
| Worth | 1,861 | 1,520 | 2,036 | 1,374 | 175 | -146 |
| 152,939 | 169,341 | 161,395 | 164,034 | 8,456 | -5,307 |
Overall, Hubbell got 5,307 fewer votes than Finkenauer, while Reynolds racked up 8,456 more votes than Blum. Hubbell only did better in Marshall and Poweshiek counties, but that is almost certainly due to media markets. Those are the only two counties that fall in the Des Moines media market; all of the 1st District TV ads ran in the Cedar Rapids media market.
Now, Hubbell did take some sizable hits in Dubuque and Linn counties when you look at just raw votes. That doesn’t tell the whole story, though, as he actually came close to Finkenauer’s percentages there. For example, Finkenauer took 57% of the vote in Linn County; Hubbell had 55% there.
Let’s look at the counties based on percentages of the vote, sorted by the counties that Hubbell fell behind Finkenauer the worst in:
| Hubbell % Diff | Blum % | Abby % | Reynolds % | Hubbell % | |
| Howard | -5% | 52% | 44% | 57% | 39% |
| Worth | -5% | 53% | 44% | 58% | 39% |
| Allamakee | -4% | 54% | 42% | 59% | 38% |
| Clayton | -4% | 55% | 42% | 57% | 38% |
| Dubuque | -4% | 45% | 52% | 49% | 48% |
| Winneshiek | -4% | 44% | 52% | 49% | 48% |
| Fayette | -3% | 51% | 45% | 55% | 42% |
| Jackson | -3% | 53% | 45% | 55% | 42% |
| Mitchell | -3% | 56% | 41% | 60% | 38% |
| Benton | -2% | 56% | 41% | 59% | 39% |
| Delaware | -2% | 60% | 37% | 62% | 35% |
| Iowa | -2% | 55% | 41% | 59% | 39% |
| Jones | -2% | 52% | 44% | 55% | 42% |
| Linn | -2% | 40% | 57% | 42% | 55% |
| Black Hawk | -1% | 42% | 56% | 43% | 55% |
| Bremer | -1% | 52% | 45% | 54% | 44% |
| Buchanan | -1% | 49% | 47% | 52% | 46% |
| Tama | -1% | 52% | 45% | 54% | 44% |
| Poweshiek | 0% | 49% | 48% | 50% | 48% |
| Marshall | 1% | 50% | 47% | 49% | 48% |
| Total | -2% | 46% | 51% | 48% | 49% |
It was largely the counties in the rural northeast part of the district that Hubbell underperformed Finkenauer by percentage of the vote the most. Many of those counties, including Howard and Allamakee, were some of those places where Republicans saw the largest swings to them with Trump in the entire country back in 2016.
Hubbell fell behind in Dubuque, though that’s also Finkenauer’s home county and where her state legislative district is (yes, it’s Blum’s home too, but it always seemed like Finkenauer got a better advantage out of it). But Hubbell stayed pretty close with Finkenauer’s percentages in the two other large counties of Black Hawk and Linn.
So, that’s how Hubbell lost while the congressionals won by the numbers. But why did that happen?
That’s a more subjective question to which we may not know the exact answer, but we can take some guesses. Among them could be:
- Voters wanted a check on Trump, but thought Iowa was generally on the right track.
- Reynolds’ closing TV ads were more effective.
- Outside GOP groups’ ads that attacked Finkenauer and Axne were so over-the-top that they backfired. The governor’s race didn’t have as incendiary of ads.
- Voters wanted to elect more women.
- The Democratic congressional candidates were better at exciting voters.
- The lack of straight-ticket voting cut down on waves for either party.
There’s probably a lot more reasons, all of which played small parts here and there to come together for last night’s results. When we get to drill down into precinct-level data, we may be able to make better-informed guesses. For now, this gives at least some sense of how it all happened.
Starting Line will dig into more election results as the week continues (after I catch up on some sleep).
by Pat Rynard
Posted 11/7/18

Lanon Baccam wins 3rd District Dem primary, will face Zach Nunn
Baccam defeats Melissa Vine to challenge Republican incumbent Lanon Baccam defeated Melissa Vine in Tuesday’s Democratic primary for Iowa’s 3rd...

Hardin County man running for office as Trump-loving Democrat to local party’s dismay
Brad Rewoldt, who recently changed his party affiliation from Republican, says his support of Trump will probably 'piss off' Democrats There is a...

Scheetz: Tax cuts for all Iowans, not just the wealthy
State Rep. Sami Scheetz says all Iowans should benefit from tax cuts via a sales tax reduction As a state representative, my job is to serve the...

Kalbach: What Iowa Republicans focused on during legislative session
Our state legislative session finished up towards the end of April, and I’m glad it’s over! From further de-funding and privatizing our public...

Advocates file suit to stop Iowa’s ‘unconstitutional’ immigration law
Immigration advocates filed a federal lawsuit Thursday to stop Iowa’s new immigration law—SF 2340—from taking effect arguing that the legislation...

Iowa Republicans make outlawing gay marriage key 2024 campaign priority
Iowa Republicans have made outlawing gay marriage a key goal in their 2024 party platform. During the Iowa GOP’s 2024 state convention on Saturday,...


