One week to go, finally.
We’re at the point of the campaign cycle in Iowa where campaigns cease signing up new people for absentee ballots and go solely into ballot chase and GOTV mode. The increases in requested ballots in the daily totals from here on out will be mostly from people who voted in-person that day. For mail absentee ballots, while they can be requested as late as Friday, there’s just not enough time to reliably get them sent out and returned.
Let’s take another in-depth look at the early vote numbers, as we’re to the point where many of the numbers and vote advantages are set.
The places where we could still see big jumps are Johnson, Story, Scott and Linn counties, all of which have many satellite voting locations in the last week. Democrats believe they’ll see more early voting at those places in the last week than what happened in 2012, including in Johnson County where satellite locations were reduced from 2012 levels.
Here’s how the statewide numbers look from Monday’s report, compared to this point in the election in 2012:
| Voted | |||
| Party | Today | Then | % Diff |
| Democrat | 198,736 | 219,778 | 90% |
| Republican | 155,425 | 159,866 | 97% |
| No Party | 97,503 | 117,485 | 83% |
And for requests:
| Requests | |||
| Party | Today | Then | % Diff |
| Democrat | 248,314 | 279,968 | 89% |
| Republican | 198,459 | 198,383 | 100% |
| No Party | 132,883 | 165,025 | 81% |
Democrats hold over a 40,000 early vote advantage, and are nearing their 2012 numbers.
Despite the worrying early numbers in September, Iowa Democrats were confident their planning and strategy was on track. It seems that was the case, as Democrats have steadily climbed to 90% of their early vote total from this point in 2012. It likely won’t get up to the 2012 levels, but again, Barack Obama won by 6% then. The real question will be whether independents break heavily for Trump in Iowa – if that’s the case, Democrats would need to get ever closer to their 2012 amount. We’ll see in a week.
Republicans have hovered just above or below their 2012 performance in the early vote. All in all, it likely means Iowa will be extremely close on election night.
Democrats’ return rate is 80%, one tick above the 79% return rate they had at this point in 2012. That’s good considering their all-out absentee efforts started later. Republicans have a 78% return rate, three points below their 81% return rate at this point in 2012.
Iowa Democrats say they’ve knocked on the doors of nearly 390,000 Iowans in October, which has driven them to their slow but steady improvement in the early vote. And their increasing focus on in-person early voting helped keep their advantage over Republicans, plus it helped cut down on return rate and ballot chase problems.
County-by-County
The statewide numbers are interesting, but the county results are fun to analyze. Let’s start with where each party has the biggest raw number lead in early votes. Here’s the top ten counties for Democrats:
| County | Dem Voted | No Party Voted | GOP Voted | Dem Lead |
| Polk | 35,656 | 11,625 | 18,563 | 17,093 |
| Johnson | 17,155 | 5,493 | 4,272 | 12,883 |
| Linn | 14,406 | 7,081 | 7,705 | 6,701 |
| Dubuque | 9,222 | 3,111 | 4,220 | 5,002 |
| Black Hawk | 9,382 | 4,392 | 5,423 | 3,959 |
| Scott | 12,148 | 7,033 | 8,431 | 3,717 |
| Story | 7,500 | 4,265 | 3,905 | 3,595 |
| Lee | 3,009 | 1,118 | 1,221 | 1,788 |
| Des Moines | 3,432 | 1,314 | 1,675 | 1,757 |
| Clinton | 3,454 | 2,171 | 2,140 | 1,314 |
And here’s the Republicans’ best leads by county:
| County | Dem Voted | No Party Voted | GOP Voted | Dem Lead |
| Sioux | 382 | 395 | 3,191 | -2,809 |
| Plymouth | 763 | 705 | 2,002 | -1,239 |
| Dickinson | 858 | 973 | 1,829 | -971 |
| Mahaska | 838 | 586 | 1,720 | -882 |
| Clay | 547 | 448 | 1,412 | -865 |
| Lyon | 128 | 135 | 933 | -805 |
| O’Brien | 259 | 209 | 1059 | -800 |
| Marion | 1,945 | 1,304 | 2,695 | -750 |
| Mills | 493 | 335 | 1,228 | -735 |
| Page | 425 | 263 | 1,126 | -701 |
Nothing too surprising here. Democrats hold the largest leads in the biggest, urban counties. Republicans’ best advantages are almost entirely in Western Iowa.
The better thing to look at is how these numbers compare to the final early vote totals by registered Democrats and Republicans in 2012. These numbers are different from the statewide – I’m comparing this year’s current total to the final early vote in 2012, not where they stood at this point in 2012 (there aren’t easy records of that online).
Here’s Democrats’ best 15 counties compared to the final early vote turnout in 2012:
| County | Dem Voted | Ds Early in 12 | D % Early in 12 |
| Winneshiek | 1,903 | 1,974 | 96% |
| Dallas | 4,575 | 5,296 | 86% |
| Story | 7,500 | 8,769 | 86% |
| Poweshiek | 1,744 | 2,112 | 83% |
| Worth | 310 | 388 | 80% |
| Winnebago | 393 | 499 | 79% |
| Polk | 35,656 | 45,871 | 78% |
| Mitchell | 516 | 669 | 77% |
| Dubuque | 9,222 | 12,060 | 76% |
| Bremer | 1,415 | 1,862 | 76% |
| Ringgold | 238 | 317 | 75% |
| Muscatine | 2,433 | 3,243 | 75% |
| Dickinson | 858 | 1,144 | 75% |
| Cass | 433 | 582 | 74% |
| Johnson | 17,155 | 23,098 | 74% |
Winneshiek County is easily going to break records this year with their early vote, which ought to boost Pat Ritter’s chances in the open house seat there. Dallas County is doing very well, though part of that may be due to the natural population growth there. Regardless, Dallas is turning into a real opportunity county for Democrats moving forward. Story County has been over-performing all year despite no highly competitive legislative races there.
It’s good to see Polk County doing so well, where Democrats rack up a good chunk of their statewide win margins. Poweshiek is doing surprisingly well, as is Winnebago. Many of the other rural counties on this list have targeted legislative races in them, like Worth, Mitchell, Bremer and Muscatine.
Then there’s a handful like Ringgold and Cass that are defying expectations of rural counties doing decent for Democrats this year. Perhaps that’s from Jim Mowrer’s field team?
I’ll add the full list at the very bottom of this post for both parties. Counties that are further down for Democrats than they’d like to see includes Linn, at #37 – again, they had to deal with the flood, but Monica Vernon needs a strong turnout here to defeat Rod Blum. A couple other larger counties fall beneath the midpoint, including Cerro Gordo (#54), Clinton (#64), Woodbury (#70), Webster (#78) and Wapello (#81). All of those contain a lot of working class Democrats and could be reflecting the presidential race dynamics.
The worst on the list are almost all in rural Western Iowa. Democrats always waver on sending staffing resources there simply due to the fact that there’s fewer Democrats to turn out. With numbers like these, however, the local Democratic county parties may have to reassess their efforts going forward, and figure out to deal with a lack of support if things don’t change.
Now here’s the top 15 Republican counties:
| County | GOP Voted | Rs Early in 12 | R % Early in 12 |
| Audubon | 542 | 563 | 96% |
| Worth | 377 | 408 | 92% |
| Emmet | 365 | 404 | 90% |
| Dickinson | 1,829 | 2,055 | 89% |
| Louisa | 537 | 606 | 89% |
| Jackson | 872 | 985 | 89% |
| Cherokee | 977 | 1,108 | 88% |
| Chickasaw | 655 | 744 | 88% |
| Clay | 1,412 | 1,613 | 88% |
| Page | 1,126 | 1,312 | 86% |
| Ringgold | 379 | 448 | 85% |
| Davis | 417 | 496 | 84% |
| Decatur | 378 | 461 | 82% |
| Hancock | 653 | 798 | 82% |
| Winnebago | 557 | 685 | 81% |
Every single one of Republicans’ best counties are in rural parts of the state, with Jackson County in Eastern Iowa the most populous. Several of these track with key legislative districts, others just seem to be naturally improved for Republicans, especially those in Western Iowa. There doesn’t seem to be any big trend other than that.
Republicans’ best populous counties are Muscatine (#19), Black Hawk (#22) and Warren (#34).
But many of the state’s largest counties are lagging for Republicans, including Polk (#70), Scott (#81), Linn (#95) and Johnson (#97). This also might reflect the presidential race’s impact, with the counties that contain the higher-educated, wealthier precincts of Republicans turning out so poorly.
The big takeaway from the counties is this: Republicans are matching their 2012 numbers, so clearly they’re making up their poor showings in some urban counties by even better turnouts in the rurals. That’s all well and good, but Republicans should keep a close eye on this. Longterm, you don’t want to be falling behind in the counties that are growing in population in Iowa. Some of this can be fixed with a strong field effort in the urban counties, but they’ll also need to watch where the national party’s message goes post-Trump.
Legislative Races
We have a very good idea of where the key legislative races stand at this point in terms of who has the advantage in early votes. Democrats typically win a majority of the No Party early votes thanks to their targeting efforts, but since we can’t tell that for sure right now, I’m just leaving them out. Instead, let’s compare how big of a lead each candidate has in their party’s early vote. There’s not an easy way to compare this to how the early vote turned out in 2012 (without going precinct-by-precinct in the past statistics files, which I don’t feel like doing!), so we’ll just do a raw vote advantage (though again, we don’t know if every registered Democrat voted for the Democrat).
Here’s the list sorted by early vote advantage. Tom Courtney and Rich Taylor aren’t thought to be at risk, their races are just ones to keep an eye on in case of a Trump wave in Southeast Iowa.
| District | Senator | Ds Voted | Rs Voted | Voted Diff |
| SD 44 | Courtney | 4,279 | 2,571 | 1,708 |
| SD 30 | Danielson | 4,912 | 3,523 | 1,389 |
| SD 34 | Mathis | 4,116 | 2,763 | 1,353 |
| SD 42 | Taylor | 4,095 | 2,904 | 1,191 |
| SD 08 | Gronstal | 3,288 | 2,596 | 692 |
| SD 32 | Schoenjahn | 3,359 | 2,793 | 566 |
| SD 36 | Sodders | 3,528 | 3,060 | 468 |
| SD 46 | Brase | 3,879 | 3,433 | 446 |
| SD 26 | Wilhelm | 3,340 | 2,966 | 374 |
| SD 48 | Zumbach | 2,814 | 2,683 | 131 |
| SD 28 | Breitbach | 3,738 | 3,764 | -26 |
This table shows why Democrats feel very good about both Liz Mathis and Jeff Danielson’s races. Both have run excellent early vote operations in their district. As both districts contain some of those more moderate suburban districts, its possible we’re seeing an effect from Trump depressing Republican-leaning women here.
Mike Gronstal has a decent lead, though we’ll see how many of those white, working-class Democrats in Council Bluffs are sticking with the Democratic ticket this year – likely still enough to return the Majority Leader to the Senate. Below Gronstal are the four races Republicans think they have their best shot at winning. The Zumbach and Breitbach races don’t look that great, and its where Democrats haven’t spent that many resources. As mentioned many times before, the Republicans’ registration advantage in Northeast Iowa’s SD 28 doesn’t always translate into an actual vote advantage for Republicans, so keep that in mind.
There’s other numbers we could look at, like the return percentages or the percentage of registered Democrats signed up for early vote in each district, but I honestly didn’t think they showed anything too noteworthy.
Now for the House races:
| District | Senator/Rep | Ds Voted | Rs Voted | Diff |
| HD 43 | Hagenow/Konfrst | 2,941 | 1,854 | 1087 |
| HD 57 | Stetcher | 2,613 | 1,713 | 900 |
| HD 40 | Forbes | 2,825 | 1,977 | 848 |
| HD 68 | Rizer/Donahue | 2,178 | 1,351 | 827 |
| HD 42 | Cownie/Celsi | 2,704 | 1,925 | 779 |
| HD 58 | McKean/Kean | 2,039 | 1,319 | 720 |
| HD 38 | Koester/Matson | 2,230 | 1,625 | 605 |
| HD 26 | Ourth | 2,634 | 2,039 | 595 |
| HD 67 | Hinson/Seidl | 1,938 | 1,412 | 526 |
| HD 95 | Zumbach/Whitehead | 1,576 | 1,057 | 519 |
| HD 15 | McConkey | 1,572 | 1,063 | 509 |
| HD 92 | Paustian/Krumweide | 1,963 | 1,514 | 449 |
| HD 60 | Rogers/Kroeger | 2,460 | 2,041 | 419 |
| HD 55 | Bergan/Ritter | 2,396 | 2,038 | 358 |
| HD 37 | Landon/Phillips | 2,337 | 2,080 | 257 |
| HD 39 | Highfill/Morris | 2,549 | 2,366 | 183 |
| HD 88 | Kerr/Drew | 1,588 | 1,489 | 99 |
| HD 91 | Carlson/Weise | 1,916 | 1,919 | -3 |
| HD 51 | Bloomingdale/Hejhal | 1,388 | 1,478 | -90 |
| HD 56 | Ruff | 1,342 | 1,726 | -384 |
You understand now why Chris Hagenow is spending hundreds of thousands of dollars on those TV ads, right? Jennifer Konfrst’s campaign team has done a great job turning out her district, which will give them a big advantage going into Election Day.
Most of the Democrats’ biggest leads are in the suburban districts around the state. Democrats even lead in some places like HD 37 and HD 39, the strong Republican districts in Ankeny and Johnson. The rural Dubuque county SD 57 seat is the other one where Democrats are up big.
Democrats have put more money into Phil Weise’s race in Muscatine, but Ken Krumweide has the larger early vote advantage in Scott County. For an open Republican seat, rural Linn County’s HD 95 sure doesn’t have many registered Republicans voting early – in fact, it’s the lowest number of any district. The Republicans’ return percentage there is also the second-lowest of the districts on this list.
The improvement for Jackson County Republican’s early votes over 2012 might have looked bad for Jessica Kean’s chances in HD 58, but she still holds a healthy 720 voter lead and seems positioned to win.
The big concern for Democrats are in the Patti Ruff and Tim Hejhal districts. They’ll have to bank on most of the No Party voters here siding with the Democratic candidates. As I wrote before, Democratic volunteers should take a trip up to Northeast Iowa to help out.
County-by-County Charts
Here’s the full charts of percent of current early vote compared to final early vote in 2012. First sorted for the Democrats:
| County | Dem Voted | Ds Early in 12 | D % Early in 12 |
| Winneshiek | 1903 | 1974 | 96% |
| Dallas | 4575 | 5296 | 86% |
| Story | 7500 | 8769 | 86% |
| Poweshiek | 1744 | 2112 | 83% |
| Worth | 310 | 388 | 80% |
| Winnebago | 393 | 499 | 79% |
| Polk | 35656 | 45871 | 78% |
| Mitchell | 516 | 669 | 77% |
| Dubuque | 9222 | 12060 | 76% |
| Bremer | 1415 | 1862 | 76% |
| Ringgold | 238 | 317 | 75% |
| Muscatine | 2433 | 3243 | 75% |
| Dickinson | 858 | 1144 | 75% |
| Cass | 433 | 582 | 74% |
| Johnson | 17155 | 23098 | 74% |
| Warren | 3742 | 5068 | 74% |
| Louisa | 428 | 584 | 73% |
| Allamakee | 663 | 912 | 73% |
| Henry | 924 | 1274 | 73% |
| Floyd | 1035 | 1439 | 72% |
| Jasper | 2908 | 4054 | 72% |
| Jefferson | 1564 | 2188 | 71% |
| Marion | 1945 | 2760 | 70% |
| Hancock | 317 | 452 | 70% |
| Pottawattamie | 4793 | 6846 | 70% |
| Black Hawk | 9382 | 13423 | 70% |
| Boone | 1998 | 2874 | 70% |
| Mills | 493 | 713 | 69% |
| Scott | 12148 | 17603 | 69% |
| Wright | 490 | 712 | 69% |
| Grundy | 374 | 547 | 68% |
| Washington | 1004 | 1474 | 68% |
| Marshall | 2709 | 3982 | 68% |
| Clayton | 856 | 1266 | 68% |
| Butler | 415 | 614 | 68% |
| Sioux | 382 | 569 | 67% |
| Linn | 14406 | 21532 | 67% |
| Jackson | 1485 | 2241 | 66% |
| Carroll | 1099 | 1664 | 66% |
| Buchanan | 1053 | 1596 | 66% |
| Lee | 3009 | 4564 | 66% |
| Franklin | 330 | 503 | 66% |
| Howard | 460 | 702 | 66% |
| Van Buren | 169 | 259 | 65% |
| Page | 425 | 652 | 65% |
| Des Moines | 3432 | 5280 | 65% |
| Cedar | 895 | 1377 | 65% |
| Davis | 428 | 660 | 65% |
| Buena Vista | 632 | 977 | 65% |
| Osceola | 90 | 140 | 64% |
| Jones | 940 | 1464 | 64% |
| Fayette | 1050 | 1642 | 64% |
| Chickasaw | 825 | 1291 | 64% |
| Cerro Gordo | 2562 | 4050 | 63% |
| Emmet | 362 | 575 | 63% |
| Benton | 1013 | 1612 | 63% |
| Taylor | 151 | 242 | 62% |
| Montgomery | 247 | 396 | 62% |
| Monroe | 436 | 701 | 62% |
| Madison | 805 | 1296 | 62% |
| Guthrie | 483 | 778 | 62% |
| O’Brien | 259 | 418 | 62% |
| Appanoose | 673 | 1087 | 62% |
| Clinton | 3454 | 5586 | 62% |
| Union | 585 | 949 | 62% |
| Hardin | 832 | 1351 | 62% |
| Hamilton | 746 | 1218 | 61% |
| Adair | 292 | 477 | 61% |
| Delaware | 642 | 1049 | 61% |
| Woodbury | 5449 | 8919 | 61% |
| Wayne | 246 | 403 | 61% |
| Tama | 687 | 1128 | 61% |
| Adams | 194 | 319 | 61% |
| Iowa | 674 | 1109 | 61% |
| Calhoun | 353 | 581 | 61% |
| Clarke | 453 | 746 | 61% |
| Sac | 238 | 392 | 61% |
| Webster | 2084 | 3435 | 61% |
| Decatur | 365 | 606 | 60% |
| Ida | 174 | 290 | 60% |
| Wapello | 2209 | 3739 | 59% |
| Audubon | 312 | 529 | 59% |
| Lucas | 393 | 672 | 58% |
| Plymouth | 763 | 1308 | 58% |
| Shelby | 552 | 949 | 58% |
| Cherokee | 461 | 796 | 58% |
| Kossuth | 872 | 1515 | 58% |
| Harrison | 446 | 780 | 57% |
| Crawford | 589 | 1041 | 57% |
| Monona | 361 | 644 | 56% |
| Fremont | 223 | 398 | 56% |
| Pocahontas | 273 | 490 | 56% |
| Greene | 437 | 811 | 54% |
| Humboldt | 323 | 610 | 53% |
| Mahaska | 838 | 1672 | 50% |
| Clay | 547 | 1094 | 50% |
| Lyon | 128 | 262 | 49% |
| Palo Alto | 533 | 1093 | 49% |
| Keokuk | 368 | 757 | 49% |
And now for the Republicans:
| County | GOP Voted | Rs Early in 12 | R % Early in 12 |
| Audubon | 542 | 563 | 96% |
| Worth | 377 | 408 | 92% |
| Emmet | 365 | 404 | 90% |
| Dickinson | 1829 | 2055 | 89% |
| Louisa | 537 | 606 | 89% |
| Jackson | 872 | 985 | 89% |
| Cherokee | 977 | 1108 | 88% |
| Chickasaw | 655 | 744 | 88% |
| Clay | 1412 | 1613 | 88% |
| Page | 1126 | 1312 | 86% |
| Ringgold | 379 | 448 | 85% |
| Davis | 417 | 496 | 84% |
| Decatur | 378 | 461 | 82% |
| Hancock | 653 | 798 | 82% |
| Winnebago | 557 | 685 | 81% |
| Wapello | 1339 | 1649 | 81% |
| Benton | 1171 | 1455 | 80% |
| Crawford | 794 | 993 | 80% |
| Muscatine | 2414 | 3060 | 79% |
| Dubuque | 4220 | 5353 | 79% |
| Clayton | 832 | 1058 | 79% |
| Black Hawk | 5423 | 6925 | 78% |
| Cedar | 935 | 1196 | 78% |
| O’Brien | 1059 | 1356 | 78% |
| Floyd | 757 | 978 | 77% |
| Delaware | 1108 | 1433 | 77% |
| Fremont | 455 | 590 | 77% |
| Howard | 331 | 430 | 77% |
| Calhoun | 563 | 733 | 77% |
| Lee | 1221 | 1602 | 76% |
| Adams | 308 | 405 | 76% |
| Mitchell | 596 | 786 | 76% |
| Cass | 1041 | 1392 | 75% |
| Warren | 3110 | 4161 | 75% |
| Madison | 1071 | 1437 | 75% |
| Taylor | 371 | 499 | 74% |
| Bremer | 1326 | 1784 | 74% |
| Pottawattamie | 5397 | 7262 | 74% |
| Jasper | 1756 | 2363 | 74% |
| Keokuk | 439 | 592 | 74% |
| Greene | 522 | 704 | 74% |
| Des Moines | 1675 | 2261 | 74% |
| Cerro Gordo | 2028 | 2741 | 74% |
| Mills | 1228 | 1660 | 74% |
| Woodbury | 5365 | 7259 | 74% |
| Webster | 1498 | 2035 | 74% |
| Fayette | 1019 | 1386 | 74% |
| Hamilton | 923 | 1256 | 73% |
| Dallas | 5128 | 6992 | 73% |
| Wayne | 349 | 476 | 73% |
| Henry | 1415 | 1932 | 73% |
| Pocahontas | 400 | 547 | 73% |
| Winneshiek | 1511 | 2074 | 73% |
| Humboldt | 683 | 941 | 73% |
| Osceola | 428 | 590 | 73% |
| Marshall | 2262 | 3120 | 73% |
| Sioux | 3191 | 4408 | 72% |
| Clinton | 2140 | 2957 | 72% |
| Guthrie | 648 | 896 | 72% |
| Butler | 1009 | 1398 | 72% |
| Harrison | 676 | 939 | 72% |
| Monona | 374 | 521 | 72% |
| Lucas | 581 | 813 | 71% |
| Ida | 397 | 557 | 71% |
| Jones | 880 | 1235 | 71% |
| Sac | 583 | 819 | 71% |
| Montgomery | 745 | 1052 | 71% |
| Tama | 639 | 904 | 71% |
| Marion | 2695 | 3819 | 71% |
| Polk | 18563 | 26319 | 71% |
| Shelby | 1058 | 1508 | 70% |
| Buchanan | 773 | 1104 | 70% |
| Allamakee | 1022 | 1461 | 70% |
| Story | 3905 | 5605 | 70% |
| Clarke | 453 | 651 | 70% |
| Monroe | 413 | 594 | 70% |
| Kossuth | 871 | 1253 | 70% |
| Carroll | 899 | 1302 | 69% |
| Plymouth | 2002 | 2902 | 69% |
| Grundy | 793 | 1152 | 69% |
| Scott | 8431 | 12317 | 68% |
| Appanoose | 647 | 947 | 68% |
| Wright | 797 | 1183 | 67% |
| Washington | 1389 | 2062 | 67% |
| Iowa | 771 | 1147 | 67% |
| Van Buren | 347 | 522 | 66% |
| Buena Vista | 763 | 1148 | 66% |
| Franklin | 656 | 989 | 66% |
| Poweshiek | 979 | 1485 | 66% |
| Union | 823 | 1252 | 66% |
| Palo Alto | 451 | 695 | 65% |
| Boone | 1466 | 2277 | 64% |
| Mahaska | 1720 | 2687 | 64% |
| Adair | 488 | 772 | 63% |
| Linn | 7705 | 12302 | 63% |
| Hardin | 1170 | 1898 | 62% |
| Johnson | 4272 | 7687 | 56% |
| Jefferson | 760 | 1384 | 55% |
| Lyon | 933 | 1757 | 53% |
by Pat Rynard
Posted 11/1/16

Iowa Republicans make outlawing gay marriage key 2024 campaign priority
Iowa Republicans have made outlawing gay marriage a key goal in their 2024 party platform. During the Iowa GOP’s 2024 state convention on Saturday,...
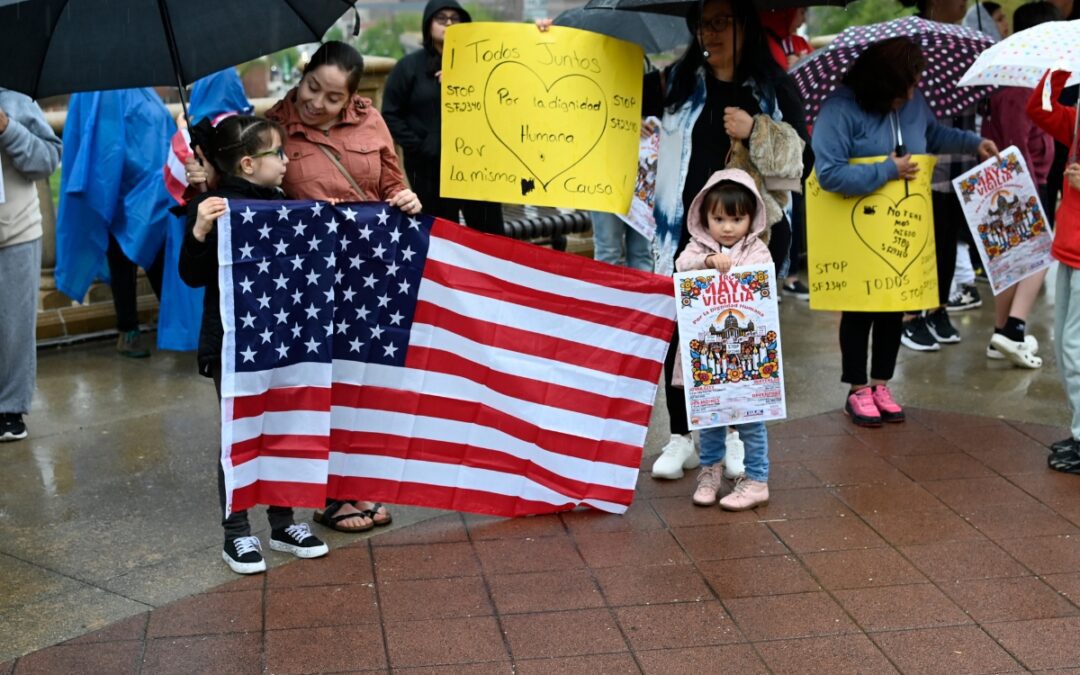
Department of Justice says Iowa immigration law violates US Constitution
If Iowa doesn’t suspend the enforcement of its new immigration law by May 7, the state could face a federal lawsuit, according to the Des Moines...
Rushing: Iowa State president said the quiet part out loud
I want to thank Iowa State University President Wendy Wintersteen for doing us all a favor by finally saying the quiet part out loud: all the...
Iowa sets aside almost $180 million for year two of voucher program
Iowa has committed nearly $180 million in taxpayer funds to support private school tuition in the 2024-25 school year, which is almost $50 million...
Kalbach: Immediate action needed on corporate ag pollution
Iowa agriculture has undergone substantial changes over the past 40 years. We see it all around us. Rather than crops and livestock being raised on...

VIDEO: Jochum calls Gov. Reynolds’ summer meal program a ‘hunger game’
Iowa Gov. Reynolds announced a competitive $900,000 grant program to feed Iowa children over the summer, months after she declined $29 million in...