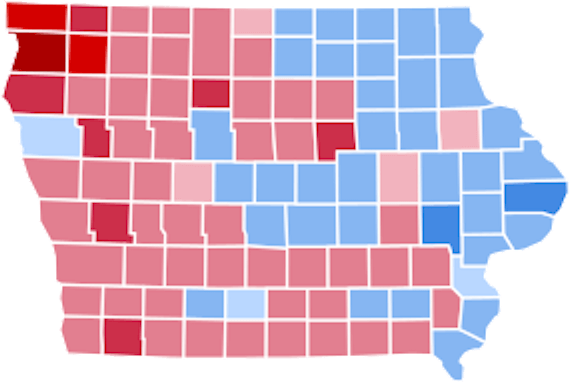
It’s crunch time for Democrats’ and Republicans’ early vote efforts in Iowa. With just two and a half weeks left until Election Day, campaigns are scrambling to pick up absentee ballots and turn voters out to early voting locations. There’s plenty of numbers to pore over, so let’s get right into it.
First off, a check on the statewide numbers of absentee requests compared to this time in 2012:
| Requests | |||
| Party | Today | Then | % Diff |
| Democrat | 182,064 | 217,964 | 84% |
| Republican | 150,169 | 147,112 | 102% |
| No Party | 88,673 | 112,131 | 79% |
And now a look at the statewide numbers of who has already voted compared to this time in 2012:
| Voted | |||
| Party | Today | Then | % Diff |
| Democrat | 114,737 | 147,234 | 78% |
| Republican | 75,782 | 92,072 | 82% |
| No Party | 44,732 | 61,833 | 72% |
Democrats still lag their 2012 numbers, but they’ve made up significant ground from their poor early data in September that worried activists. It has always been unlikely that Democrats will get the same number of early votes as they did when Barack Obama was on the ticket. They don’t need to either, considering Obama won Iowa by six points in 2012. They just have to get close. And 84% is getting pretty close. If they bump that up to around 90%, Hillary Clinton will be well within striking range of carrying Iowa.
Also interesting is how Democrats have slowly but steadily increased their percent over 2012 day by day. Republicans’ numbers have jumped around, largely due to the bulk of their absentee efforts coming from mailers. While Republicans get a big boost every time an absentee mailer drops, Democrats have built their numbers through a huge field team and in-person early voting sites that slowly accumulate every day. Republicans and their field team and volunteers are still doing a great job in bringing in numbers better than their 2012 results, especially in a year where voter frustration is high. And they’re closing the gap between them and Democrats.
But the other thing to watch is the absentee return rate:
| Return Rate | |||
| Party | Today | Then | Diff |
| Democrat | 63% | 68% | -5% |
| Republican | 50% | 63% | -12% |
| No Party | 50% | 55% | -5% |
Because of both parties’ decisions to start their absentee efforts later, both lag their 2012 return rates. Democrats are likely better because they’re pushing lots of in-person voting (which has a return rate of 100%!). Republicans have 74,387 ballots still out in the field, while Democrats have 67,327 unreturned. Both sides have a lot of work to do in the final weeks.
Now let’s have some fun by looking at how each individual county is doing, which I’m sure will be interesting to local activists on both sides. The Secretary of State’s office recently began listing the early vote data out by counties.
Here’s the top 15 counties where Democrats have the largest raw number lead in absentee requests (At the end of the post I’ll list out every single county):
| County | Dem Req | GOP Req | NP Req | Dem Lead |
| Polk | 32,321 | 18,079 | 9,863 | 14,242 |
| Johnson | 13,187 | 3,672 | 3,927 | 9,515 |
| Linn | 13,685 | 8,039 | 7,160 | 5,646 |
| Dubuque | 8,467 | 4,177 | 2,798 | 4,290 |
| Black Hawk | 8,770 | 5,341 | 3,891 | 3,429 |
| Scott | 10,865 | 7,518 | 6,082 | 3,347 |
| Story | 6,976 | 3,958 | 3,924 | 3,018 |
| Lee | 2,947 | 1,120 | 1,072 | 1,827 |
| Des Moines | 3,432 | 1,638 | 1,295 | 1,794 |
| Clinton | 3,339 | 2,088 | 2,082 | 1,251 |
| Jasper | 2,745 | 1,655 | 1,106 | 1,090 |
| Wapello | 1,954 | 1,253 | 668 | 701 |
| Jackson | 1,483 | 838 | 803 | 645 |
| Jefferson | 1,250 | 656 | 309 | 594 |
| Webster | 2,023 | 1,435 | 912 | 588 |
As one would expect, Democrats hold large early vote leads in the most-populous counties, as well as their liberal stronghold of Johnson County.
Here’s the top 15 counties for Republican early vote leads:
| County | Dem Req | GOP Req | NP Req | Dem Lead |
| Sioux | 421 | 3,643 | 452 | -3,222 |
| Plymouth | 695 | 1,958 | 644 | -1,263 |
| Dallas | 4,193 | 5,293 | 2,570 | -1,100 |
| Mahaska | 762 | 1,812 | 559 | -1,050 |
| Marion | 1,728 | 2,685 | 1,120 | -957 |
| Lyon | 128 | 1,060 | 134 | -932 |
| O’Brien | 255 | 1,166 | 209 | -911 |
| Dickinson | 674 | 1,495 | 699 | -821 |
| Pottawattamie | 5,039 | 5,706 | 2,895 | -667 |
| Mills | 465 | 1,130 | 280 | -665 |
| Page | 398 | 1,053 | 236 | -655 |
| Butler | 401 | 1,028 | 276 | -627 |
| Clay | 513 | 1,125 | 379 | -612 |
| Cass | 379 | 937 | 260 | -558 |
| Delaware | 592 | 1,126 | 570 | -534 |
The conservative stronghold of Northwest Iowa leads the way with Republican advantages, while Dallas County gives the GOP a big boost as well.
That’s all interesting, but it largely tracks with which counties already hold a big registration advantage. So let’s take a look at what percent of the registered voters in each county are signed up for absentees. First, the top 15 for Democrats:
| County | Dem Registered | Dem Request | Dem % |
| Winneshiek | 4080 | 1594 | 39.1% |
| Marshall | 7210 | 2617 | 36.3% |
| Story | 19359 | 6976 | 36.0% |
| Warren | 9681 | 3480 | 35.9% |
| Dallas | 12068 | 4193 | 34.7% |
| Woodbury | 17945 | 6112 | 34.1% |
| Floyd | 3007 | 1017 | 33.8% |
| Boone | 5300 | 1792 | 33.8% |
| Clinton | 10125 | 3339 | 33.0% |
| Bremer | 3939 | 1296 | 32.9% |
| Pottawattamie | 15406 | 5039 | 32.7% |
| Dubuque | 25891 | 8467 | 32.7% |
| Mitchell | 1686 | 551 | 32.7% |
| Des Moines | 10664 | 3432 | 32.2% |
| Marion | 5374 | 1728 | 32.2% |
The Northeast county of Winneshiek, home to Decorah, leads the state for Democrats by a considerable margin. Many of the counties around the Des Moines metro are near the top as well. Western Iowa’s population centers are well-represented with both Woodbury and Pottawattamie in the top 15. Several counties with key legislative races, including Winneshiek, Marshall, Floyd, Bremer and Mitchell are up high as well. Story County is doing particularly well without any major legislative contest to help.
Now here’s the Republicans:
| County | GOP Registered | GOP Request | GOP % |
| Woodbury | 20285 | 5894 | 29.1% |
| Marshall | 7586 | 2135 | 28.1% |
| Marion | 9545 | 2685 | 28.1% |
| Winneshiek | 4451 | 1245 | 28.0% |
| Union | 2754 | 769 | 27.9% |
| Shelby | 3586 | 1000 | 27.9% |
| Muscatine | 8158 | 2247 | 27.5% |
| Dickinson | 5430 | 1495 | 27.5% |
| Dallas | 19281 | 5293 | 27.5% |
| Pottawattamie | 20923 | 5706 | 27.3% |
| Clinton | 7716 | 2088 | 27.1% |
| Adams | 975 | 261 | 26.8% |
| Mahaska | 6865 | 1812 | 26.4% |
| Dubuque | 15868 | 4177 | 26.3% |
| Jackson | 3186 | 838 | 26.3% |
Many Western Iowa counties make the list here, as well as several in important legislative districts as well, like Marshall, Winneshiek, Muscatine and Jackson.
But how does this all compare to 2012? Some counties just naturally have a higher percentage of people go to the polls, especially in more rural counties. And a 5,000-vote advantage in a Democratic county is nice, but not if Democrats typically get a 8,000-vote lead out of it.
The Secretary of State’s office doesn’t list out by county where the 2012 early vote was on each day in 2012, but we can look at the final early vote number for each party. By sifting through the big 2012 statistics report, we can compare how many Democrats and Republicans voted absentee in 2012 versus how many have signed up for an absentee now (this isn’t a perfect comparison because not all absentees will be returned).
Here’s the top 15 counties for Democrats:
| County | Dem Req | Ds Abs in 12 | D % Abs in 12 |
| Mitchell | 551 | 669 | 82% |
| Winneshiek | 1594 | 1974 | 81% |
| Story | 6976 | 8769 | 80% |
| Dallas | 4193 | 5296 | 79% |
| Worth | 306 | 388 | 79% |
| Muscatine | 2528 | 3243 | 78% |
| Sioux | 421 | 569 | 74% |
| Pottawattamie | 5039 | 6846 | 74% |
| Louisa | 429 | 584 | 73% |
| Floyd | 1017 | 1439 | 71% |
| Polk | 32321 | 45871 | 70% |
| Dubuque | 8467 | 12060 | 70% |
| Bremer | 1296 | 1862 | 70% |
| Winnebago | 344 | 499 | 69% |
| Warren | 3480 | 5068 | 69% |
Many Northern Iowa counties round out this list, several of which are in the Pat Ritter or Mary Jo Wilhelm districts. Story, Dallas, Pottawattamie, Polk and Dubuque are the big counties doing well compared to their 2012 numbers (Woodbury was #16, good as well). The Story County Democrats and local staff there in particular are doing something very, very right this year. Polk appeared to be lacking early on based on the legislative numbers, but they’ve really picked up their game in recent weeks. Interestingly, two Northwest counties, Sioux and Louisa, are doing well on this metric as well.
As for those not in the top 15 – Linn County sits at #36 on the list, lower than you might like for such an important county, but they also lost over a week of field work due to the flood. Most of those at the bottom of the list are small, rural counties with few competitive races in them (see the bottom of this post for the full list). Wapello and Cerro Gordo counties are in the bottom 20. Cerro Gordo in particular is lacking in the early vote on a number of metrics.
Now here’s the Republicans:
| County | GOP Req | Rs Abs in 12 | R % Abs in 12 |
| Worth | 373 | 408 | 91% |
| O’Brien | 1166 | 1356 | 86% |
| Jackson | 838 | 985 | 85% |
| Louisa | 505 | 606 | 83% |
| Chickasaw | 617 | 744 | 83% |
| Sioux | 3643 | 4408 | 83% |
| Clayton | 863 | 1058 | 82% |
| Woodbury | 5894 | 7259 | 81% |
| Page | 1053 | 1312 | 80% |
| Audubon | 449 | 563 | 80% |
| Ringgold | 356 | 448 | 79% |
| Delaware | 1126 | 1433 | 79% |
| Pottawattamie | 5706 | 7262 | 79% |
| Dubuque | 4177 | 5353 | 78% |
| Benton | 1128 | 1455 | 78% |
You can tell Republicans have been doing a lot of work in Mary Jo Wilhelm’s district, with Worth and Chickasaw near the top of the list. They also have impressive numbers for legislative battlegrounds in Jackson, Pottawattamie, Clayton and Dubuque counties.
However, outside of Pottawattamie and Dubuque, none of the state’s largest counties are in the top tier for Republicans. Polk is down at #53 for Republicans, Linn is at #73 and – amazingly – Scott is at #89. That’s typically one of their best-organized counties in the state. Republicans may not win these counties, but there’s still a lot of votes for them there. A larger field team in the state’s largest counties should have counteracted this.
You can download and play around with the entire spreadsheet I worked off of here. Below is the full list sorted by 2012 percentages. First, the Democrats:
| County | Dem Req | Ds Abs in 12 | D % Abs in 12 |
| Mitchell | 551 | 669 | 82% |
| Winneshiek | 1594 | 1974 | 81% |
| Story | 6976 | 8769 | 80% |
| Dallas | 4193 | 5296 | 79% |
| Worth | 306 | 388 | 79% |
| Muscatine | 2528 | 3243 | 78% |
| Sioux | 421 | 569 | 74% |
| Pottawattamie | 5039 | 6846 | 74% |
| Louisa | 429 | 584 | 73% |
| Floyd | 1017 | 1439 | 71% |
| Polk | 32321 | 45871 | 70% |
| Dubuque | 8467 | 12060 | 70% |
| Bremer | 1296 | 1862 | 70% |
| Winnebago | 344 | 499 | 69% |
| Warren | 3480 | 5068 | 69% |
| Woodbury | 6112 | 8919 | 69% |
| Jasper | 2745 | 4054 | 68% |
| Allamakee | 605 | 912 | 66% |
| Jackson | 1483 | 2241 | 66% |
| Marshall | 2617 | 3982 | 66% |
| Osceola | 92 | 140 | 66% |
| Clayton | 830 | 1266 | 66% |
| Black Hawk | 8770 | 13423 | 65% |
| Butler | 401 | 614 | 65% |
| Wright | 465 | 712 | 65% |
| Grundy | 357 | 547 | 65% |
| Mills | 465 | 713 | 65% |
| Cass | 379 | 582 | 65% |
| Des Moines | 3432 | 5280 | 65% |
| Henry | 825 | 1274 | 65% |
| Lee | 2947 | 4564 | 65% |
| Fayette | 1051 | 1642 | 64% |
| Tama | 722 | 1128 | 64% |
| Howard | 448 | 702 | 64% |
| Ringgold | 202 | 317 | 64% |
| Linn | 13685 | 21532 | 64% |
| Buchanan | 1005 | 1596 | 63% |
| Marion | 1728 | 2760 | 63% |
| Chickasaw | 806 | 1291 | 62% |
| Boone | 1792 | 2874 | 62% |
| Carroll | 1036 | 1664 | 62% |
| Scott | 10865 | 17603 | 62% |
| Calhoun | 358 | 581 | 62% |
| Page | 398 | 652 | 61% |
| O’Brien | 255 | 418 | 61% |
| Hancock | 275 | 452 | 61% |
| Appanoose | 660 | 1087 | 61% |
| Clinton | 3339 | 5586 | 60% |
| Buena Vista | 583 | 977 | 60% |
| Dickinson | 674 | 1144 | 59% |
| Webster | 2023 | 3435 | 59% |
| Van Buren | 152 | 259 | 59% |
| Franklin | 295 | 503 | 59% |
| Madison | 757 | 1296 | 58% |
| Jones | 852 | 1464 | 58% |
| Poweshiek | 1209 | 2112 | 57% |
| Guthrie | 445 | 778 | 57% |
| Jefferson | 1250 | 2188 | 57% |
| Johnson | 13187 | 23098 | 57% |
| Washington | 838 | 1474 | 57% |
| Hardin | 766 | 1351 | 57% |
| Delaware | 592 | 1049 | 56% |
| Monroe | 395 | 701 | 56% |
| Montgomery | 223 | 396 | 56% |
| Taylor | 136 | 242 | 56% |
| Emmet | 323 | 575 | 56% |
| Sac | 219 | 392 | 56% |
| Benton | 896 | 1612 | 56% |
| Hamilton | 672 | 1218 | 55% |
| Lucas | 370 | 672 | 55% |
| Iowa | 610 | 1109 | 55% |
| Shelby | 521 | 949 | 55% |
| Wayne | 221 | 403 | 55% |
| Cedar | 753 | 1377 | 55% |
| Adams | 174 | 319 | 55% |
| Davis | 360 | 660 | 55% |
| Union | 516 | 949 | 54% |
| Cerro Gordo | 2191 | 4050 | 54% |
| Kossuth | 819 | 1515 | 54% |
| Harrison | 419 | 780 | 54% |
| Adair | 256 | 477 | 54% |
| Plymouth | 695 | 1308 | 53% |
| Ida | 153 | 290 | 53% |
| Pocahontas | 257 | 490 | 52% |
| Wapello | 1954 | 3739 | 52% |
| Monona | 336 | 644 | 52% |
| Fremont | 203 | 398 | 51% |
| Crawford | 527 | 1041 | 51% |
| Clarke | 373 | 746 | 50% |
| Cherokee | 395 | 796 | 50% |
| Humboldt | 301 | 610 | 49% |
| Lyon | 128 | 262 | 49% |
| Clay | 513 | 1094 | 47% |
| Audubon | 246 | 529 | 47% |
| Mahaska | 762 | 1672 | 46% |
| Keokuk | 343 | 757 | 45% |
| Greene | 367 | 811 | 45% |
| Palo Alto | 455 | 1093 | 42% |
| Decatur | 247 | 606 | 41% |
And now the Republicans:
| County | GOP Req | Rs Abs in 12 | R % Abs in 12 |
| Worth | 373 | 408 | 91% |
| O’Brien | 1166 | 1356 | 86% |
| Jackson | 838 | 985 | 85% |
| Louisa | 505 | 606 | 83% |
| Chickasaw | 617 | 744 | 83% |
| Sioux | 3643 | 4408 | 83% |
| Clayton | 863 | 1058 | 82% |
| Woodbury | 5894 | 7259 | 81% |
| Page | 1053 | 1312 | 80% |
| Audubon | 449 | 563 | 80% |
| Ringgold | 356 | 448 | 79% |
| Delaware | 1126 | 1433 | 79% |
| Pottawattamie | 5706 | 7262 | 79% |
| Dubuque | 4177 | 5353 | 78% |
| Benton | 1128 | 1455 | 78% |
| Crawford | 769 | 993 | 77% |
| Cedar | 926 | 1196 | 77% |
| Calhoun | 567 | 733 | 77% |
| Black Hawk | 5341 | 6925 | 77% |
| Pocahontas | 420 | 547 | 77% |
| Hancock | 612 | 798 | 77% |
| Wapello | 1253 | 1649 | 76% |
| Dallas | 5293 | 6992 | 76% |
| Emmet | 304 | 404 | 75% |
| Fayette | 1033 | 1386 | 75% |
| Cherokee | 824 | 1108 | 74% |
| Keokuk | 439 | 592 | 74% |
| Osceola | 437 | 590 | 74% |
| Guthrie | 663 | 896 | 74% |
| Monona | 384 | 521 | 74% |
| Ida | 410 | 557 | 74% |
| Butler | 1028 | 1398 | 74% |
| Muscatine | 2247 | 3060 | 73% |
| Dickinson | 1495 | 2055 | 73% |
| Des Moines | 1638 | 2261 | 72% |
| Warren | 3009 | 4161 | 72% |
| Harrison | 679 | 939 | 72% |
| Tama | 650 | 904 | 72% |
| Fremont | 423 | 590 | 72% |
| Howard | 304 | 430 | 71% |
| Grundy | 814 | 1152 | 71% |
| Story | 3958 | 5605 | 71% |
| Clinton | 2088 | 2957 | 71% |
| Webster | 1435 | 2035 | 71% |
| Marion | 2685 | 3819 | 70% |
| Jasper | 1655 | 2363 | 70% |
| Lee | 1120 | 1602 | 70% |
| Clay | 1125 | 1613 | 70% |
| Floyd | 682 | 978 | 70% |
| Buchanan | 769 | 1104 | 70% |
| Davis | 342 | 496 | 69% |
| Humboldt | 647 | 941 | 69% |
| Polk | 18079 | 26319 | 69% |
| Winnebago | 470 | 685 | 69% |
| Marshall | 2135 | 3120 | 68% |
| Wright | 809 | 1183 | 68% |
| Sac | 560 | 819 | 68% |
| Mitchell | 537 | 786 | 68% |
| Bremer | 1215 | 1784 | 68% |
| Mills | 1130 | 1660 | 68% |
| Appanoose | 644 | 947 | 68% |
| Taylor | 339 | 499 | 68% |
| Iowa | 778 | 1147 | 68% |
| Madison | 971 | 1437 | 68% |
| Plymouth | 1958 | 2902 | 67% |
| Mahaska | 1812 | 2687 | 67% |
| Cass | 937 | 1392 | 67% |
| Decatur | 310 | 461 | 67% |
| Jones | 830 | 1235 | 67% |
| Hamilton | 839 | 1256 | 67% |
| Montgomery | 701 | 1052 | 67% |
| Shelby | 1000 | 1508 | 66% |
| Linn | 8039 | 12302 | 65% |
| Carroll | 847 | 1302 | 65% |
| Monroe | 383 | 594 | 64% |
| Adams | 261 | 405 | 64% |
| Kossuth | 803 | 1253 | 64% |
| Lucas | 514 | 813 | 63% |
| Buena Vista | 722 | 1148 | 63% |
| Franklin | 621 | 989 | 63% |
| Greene | 442 | 704 | 63% |
| Allamakee | 916 | 1461 | 63% |
| Boone | 1413 | 2277 | 62% |
| Cerro Gordo | 1696 | 2741 | 62% |
| Poweshiek | 914 | 1485 | 62% |
| Van Buren | 321 | 522 | 61% |
| Union | 769 | 1252 | 61% |
| Palo Alto | 425 | 695 | 61% |
| Scott | 7518 | 12317 | 61% |
| Lyon | 1060 | 1757 | 60% |
| Wayne | 286 | 476 | 60% |
| Winneshiek | 1245 | 2074 | 60% |
| Washington | 1224 | 2062 | 59% |
| Hardin | 1110 | 1898 | 58% |
| Henry | 1101 | 1932 | 57% |
| Clarke | 369 | 651 | 57% |
| Adair | 426 | 772 | 55% |
| Johnson | 3672 | 7687 | 48% |
| Jefferson | 656 | 1384 | 47% |
by Pat Rynard
Posted 10/21/16

Big corporations are suing to block Biden’s efforts to lower costs
From the cost of medication to education to everyday expenses, the Biden administration has passed several laws and implemented many federal rules...

Iowa Republicans make outlawing gay marriage key 2024 campaign priority
Iowa Republicans have made outlawing gay marriage a key goal in their 2024 party platform. During the Iowa GOP’s 2024 state convention on Saturday,...
Department of Justice says Iowa immigration law violates US Constitution
If Iowa doesn’t suspend the enforcement of its new immigration law by May 7, the state could face a federal lawsuit, according to the Des Moines...

Rushing: Iowa State president said the quiet part out loud
I want to thank Iowa State University President Wendy Wintersteen for doing us all a favor by finally saying the quiet part out loud: all the...
Iowa sets aside almost $180 million for year two of voucher program
Iowa has committed nearly $180 million in taxpayer funds to support private school tuition in the 2024-25 school year, which is almost $50 million...
Kalbach: Immediate action needed on corporate ag pollution
Iowa agriculture has undergone substantial changes over the past 40 years. We see it all around us. Rather than crops and livestock being raised on...


