
State-reported COVID-19 positivity rates are routinely lower than media or individual data collector’s counts, leaving some confused by Iowa’s numbers—important benchmarks used to determine if a school district can switch to online learning during periods of the pandemic.
After Gov. Kim Reynolds announced that a county’s positivity rate must be at or more than 15% and absenteeism at 10% or higher for at least two weeks in order for the state to consider all-online learning requests, last week Iowa’s Department of Public Health released on their website a map of counties with 14-day average positivity rates.
But when checked against the calculations of the Cedar Rapids Gazette, Iowa COVID-19 Tracker and that of a former IDPH employee, the state’s counts for online learning eligibility are significantly lower.
Reynolds has noted in recent press conferences that because positivity rates were lower in Iowa, though cases continue to increase, children must get back to school in-person. She said increased testing has helped to lower positivity rates, even as total numbers of cases and hospitalizations creep back up. Currently, IDPH data reveals six school districts would be eligible for virtual instruction while The Gazette updated their map on Aug. 12, finding 12 counties are at or above 15%. Other counts vary up to 13 school districts at or more than the state’s positivity requirement.
 - Iowa Starting Line")
IDPH’s website
“The percentage that they’re calculating is way off,” said Randy Richardson, a former teacher and Iowa State Education Association director who has compared the state’s graphs with those of Iowa COVID-19 Tracker and The Gazette. “How is that being calculated? That’s going to make a huge difference in this back-to-school discussion.”

The Gazette’s map
[inline-ad id=”1″]
Ames resident Sara Willette runs Iowa COVID-19 Tracker, an independent website created at the dawn of COVID-19’s arrival in the state, where she updates and analyzes state coronavirus data twice a day—live-streaming her process via Twitch. Willette said that every 12 hours she gets a data download from IDPH, which she uses to calculate a number of percentages, including individual county positivity rates, recoveries and deaths, among others.
Eleven counties–Clarke, Floyd, Emmet, Franklin, Hardin, Humboldt, Lucas, Lyon, Shelby, Webster and Wright were all on Wednesday above 15% for 14-day average positivity rates by her calculations. Only Webster, Humboldt, Clarke, Lucas, Shelby and Franklin would be eligible for online learning by the state’s counts.
“[The state is] fiddling with things. Well, I mean, we knew this was going to happen. We all expected it because that’s what happened last time there was a metric for permanent openings,” Willette said. “The difference with this is the consequences of this is this is children. It’s horrifying that in the beginning, she decided to just sacrifice adult lives. But right now we’re talking about children.”
[inline-ad id=”2″]
The reason for the discrepancies between her and the state’s 14-day rolling averages, Willette claims, is that IDPH posts positive test results on their site sometimes outside of the 14-day window, while independent data collectors report positivity right when numbers are released to the public.
The Iowa Department of Public Health denied multiple requests for comment on how they calculate 14-day rolling averages in Iowa counties but spokeswoman Amy McCoy told the Telegraph Herald on Tuesday that “state officials are using a different method for calculating their 14-day positivity rate rather than taking the number of new confirmed cases and dividing it by the number of new tests in that span.”
“My understanding is we are looking at the daily percentage of individuals positive, then doing the 14-day-average time frame from that,” she said. “So, not necessarily the case totals individually, from each day, but the actual percentages from each day over the 14 days, divided by 14,” McCoy told the Telegraph Herald.
But individual data collectors are still skeptical of the validity of IDPH’s claim.
Data inconsistencies IDPH data can be seen in Webster county, where positives aren’t always reported on the same day as tests register in the data. An example from Willette’s data shows that on July 17, 67 positives were recorded while only 64 tests had been processed. Similarly, on July 20, 35 positives were recorded while only 14 tests had processed.
“Something is going on, on the back end. I don’t know if it’s malfeasance necessarily, but definitely there’s a lack of transparency and they’re not providing data in any version of real-time,” Willette said. “It’s not data manipulation. It’s not like they’re constructing positives in tests. I think that the positive tests are real. But they’re able to, well, kind of skew what the data looks like on any given day to make the state look safer than it is.”
[inline-ad id=”3″]
A self-described introvert, Willette has an antibody deficiency called common variable immunodeficiency—she said she takes the pandemic very seriously and fact-checks her data with her Iowa State University data scientist husband and former IDPH employees who are independently calculating their own COVID-19 numbers.
“I make sure to peer-review this stuff before anything big changes from my website because I don’t want to be releasing anything that isn’t reliable,” Willette said.
Gergely said her numbers are very close to what Willette calculates– the two have compared recent data.

Click here for a full version of one of Gergely’s spreadsheets.
“If the need arises, the public health person in you comes out,” Gergely said about the spreadsheets she posts on Facebook every day with county positivity data. “I spent 25 years putting data together in spreadsheets and tables.”
[signup_form]
Gergely said she agrees with Willette in suspecting the state posts test dates and test results at different times. Although the state seems to backdate their results so that they end up corresponding with their respective tests, Willette and Gergely said IDPH’s positivity rates can appear to be different than counts from media or individuals because calculations are being made on separate timelines.
Independent data collectors only calculate positivity rates from one table the state provides to the public daily for download– because they don’t have access to anonymized versions of the numbers, collectors like Willette and Gergely cannot ultimately connect tests and results or check IDPH’s calculations.
“Evidently, what they are doing, is when they are looking at this positivity rate for the schools, they are going back to the date that the test was actually collected, and I think depending on the laboratory that they use, depending on several things, it apparently comes up with a big difference,” she said.
“If their database would show date collected, date received, we could calculate those two things and say, ‘Oh! This is the difference.’ Even that, to tell you the truth, to come up with that big a difference is a little bit fishy, but that’s the only explanation I can come up with.”
[inline-ad id=”5”]
In total, Gergely’s positivity rates came up about 1,400 cases higher than the state’s data. Her graphs indicate about 13 counties are at or over 15% positivity compared to the state’s six.
Gergely said she trusts the people within IDPH who are “hands-on with the data, 100%.” She said she’s not completely confident with the people who are making the decisions about what to put on the COVID-19 dashboard, what the public can download and what message is being communicated to Iowans.
“I believe 100% that the [COVID-19 state website] is populated with IDPH data. But I have an issue with what numbers are being used to populate this positivity rate. I have an issue with how they are choosing those numbers to populate it and I think that decision is probably being made by the Governor or one of the Governor’s assistants,” she said. “I don’t know if they know how it looks.”
by Isabella Murray
Posted 8/12/20
Iowa Starting Line is an independently-owned progressive news outlet devoted to providing unique, insightful coverage on Iowa news and politics. We need reader support to continue operating — please donate here. Follow us on Twitter and Facebook for more coverage.

Politics
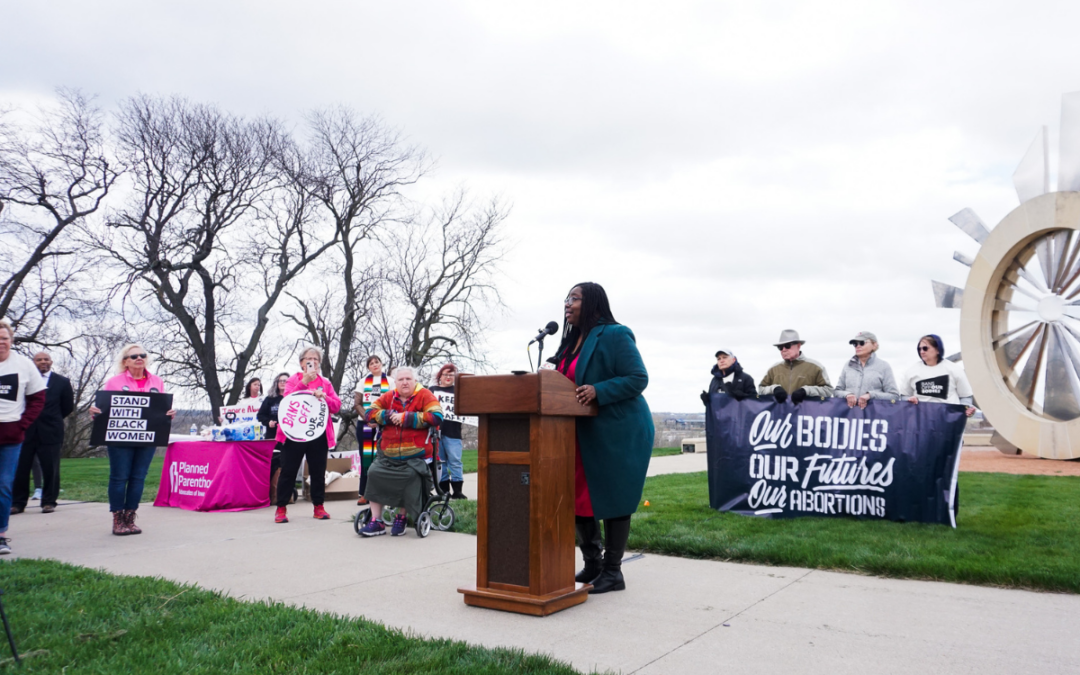
Abortion supporters rally before Iowa Supreme Court arguments
Abortion saved her life seven years ago and Leah Vanden Bosch is more grateful for it now than ever. Vanden Bosch, who serves as the development and...
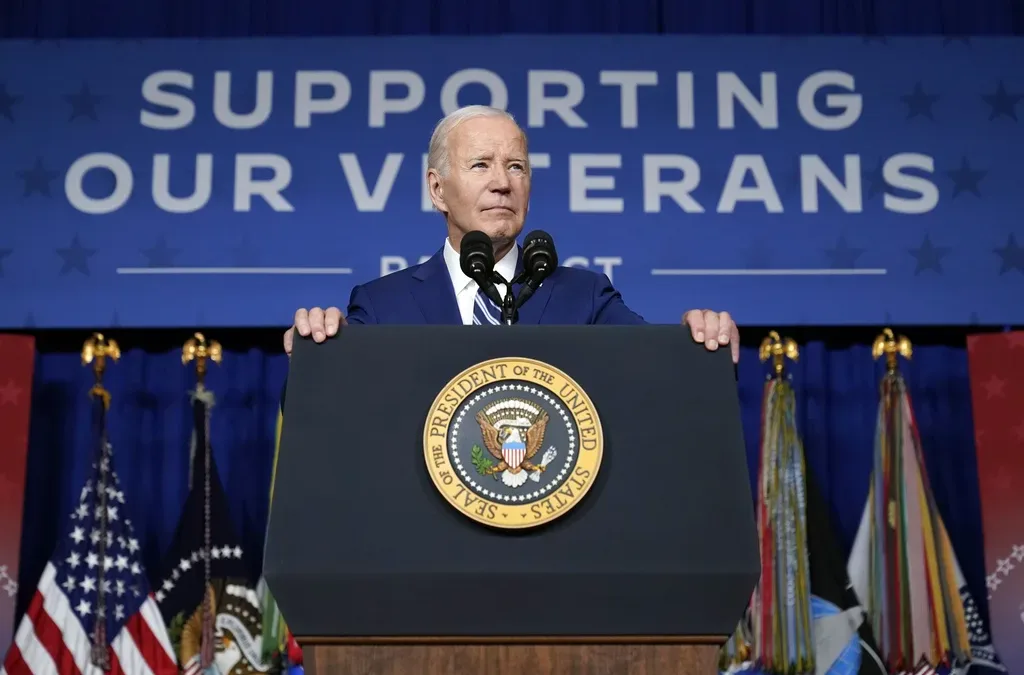
New VA program to help more than 40,000 veterans stay in their homes
The Department of Veterans Affairs (VA) will launch a “last resort” program for tens of thousands of American veterans who are in danger of losing...
Local News

No more Kum & Go? New owner Maverik of Utah retiring famous brand
Will Kum & Go have come and gone by next year? One new report claims that's the plan by the store's new owners. The Iowa-based convenience store...

Here’s a recap of the biggest headlines Iowa celebs made In 2023
For these famous Iowans, 2023 was a year of controversy, career highlights, and full-circle moments. Here’s how 2023 went for the following Iowans:...


