Now that the dust has settled from Tuesday night’s primaries across Iowa, let’s take a closer look at some of the trends and the county-level turnout numbers. There’s some interesting information there that helps explain what happened, why campaigns end up the way they do and where the Democratic Party is at. Keep in mind, however, that these are all numbers from the “unofficial results.” Late-arriving absentee ballots and other things may change numbers ever so slightly when the official canvass is done later. As always, here’s the spreadsheet I was working with.
When Races Swung, They Swung Hard
One of the most notable outcomes on Tuesday was the margins by which most of the winners in the top races won. Fred Hubbell won 55.5% of the vote with six candidates on the ballot. Abby Finkenauer took 66.9% in the 1st District. Cindy Axne captured 57.9% in a very competitive 3rd District contest. Many political observers expected all three to win, but by this much?
What happened here? First, obviously, they all ran good campaigns. Beyond that, my personal guess is that it was due in part to the record turnout Democrats saw across the state. Over 176,000 voted in the gubernatorial primary, easily surpassing Democrats’ 150,000 vote in 2006.
When you have an electorate that broad, you’ve got a lot of people coming out to vote who are only somewhat informed about the races. They’ve seen the ads, sure, but many haven’t read up extensively on the primaries or attended events with candidates. When that happens, it seems like prevailing trends have a bigger impact.
In the 3rd District, it was expected that Axne’s role as the only woman on the ballot would help. It certainly did (though that’s not to take away from the fact that Axne was a good candidate, worked hard and had good ads). You can really see the impact outside of the Des Moines media market in the counties where no one was running ads. Here’s the percentages for each sorted by Axne’s performance:
| County | Axne | Axne % | Pete | Pete % | Mauro | Mauro % |
| Mills | 267 | 72% | 56 | 15% | 48 | 13% |
| Cass | 290 | 70% | 53 | 13% | 67 | 16% |
| Montgomery | 220 | 68% | 45 | 14% | 57 | 18% |
| Madison | 496 | 63% | 106 | 13% | 185 | 23% |
| Fremont | 173 | 63% | 41 | 15% | 61 | 22% |
| Adair | 211 | 63% | 31 | 9% | 95 | 28% |
| Page | 212 | 62% | 46 | 13% | 82 | 24% |
| Dallas | 2,905 | 62% | 714 | 15% | 1,094 | 23% |
| Taylor | 102 | 60% | 24 | 14% | 45 | 26% |
| Adams | 109 | 59% | 30 | 16% | 46 | 25% |
| Warren | 1904 | 58% | 463 | 14% | 906 | 28% |
| Total: | 32,070 | 58% | 8,595 | 16% | 14,582 | 26% |
| Guthrie | 305 | 58% | 74 | 14% | 148 | 28% |
| Pottawattamie | 1,453 | 58% | 572 | 23% | 484 | 19% |
| Polk | 23,043 | 57% | 6,226 | 15% | 10,979 | 27% |
| Union | 249 | 51% | 83 | 17% | 154 | 32% |
| Ringgold | 131 | 45% | 31 | 11% | 131 | 45% |
Four of Axne’s top five counties are all in the Omaha media market. With no TV ads being run there by Eddie Mauro or Pete D’Alessandro, Democrats chose the female candidate by a wide margin. Polk County, where Mauro benefited from high South Side turnout, was a little more competitive.
Candidates like D’Alessandro were better able to compete in a county that had light turnout like Pottawattamie. Democratic turnout in the county home to Council Bluffs was only at 17%, compared to 30% statewide and 37% in Polk County. When the primary-goers are limited to the more-engaged crowd and activists, a campaign’s field efforts and candidate visits can have a bigger impact and prevailing trends are less pronounced.
The decisive wins are probably good news for Democrats as a whole, even if it must be disappointing to candidates and their supporters who came up short with relatively small percentages. It shows that the party’s base largely happy with the winning candidate, lessening the chances there will be lasting divisions by sizable parts of the party
Secretary Of State Map
The most interesting result of the election came from the primary for secretary of state that Deidre DeJear won 51% to 49%, making her the first black statewide candidate nomination in a primary. Here’s what the map looked like from the official election results website (Jim Mowrer in blue, DeJear in green):

Mowrer essentially won in most of the places where he’d run for Congress before, as well as in the media markets he advertised heavily in for those 2014 and 2016 races. It’s so stark, you can even see it in that little edge of the 4th District that cuts into Northeast Iowa in Floyd and Chickasaw counties. Compare the above map to the congressional one below:

There’s also several counties in the central and southern portion of the state that aren’t in the 3rd or 4th congressional districts but are in the Des Moines media market, where Mowrer’s name ID from his old TV spots helped out. And DeJear snagged a few counties in the western part of the state that fell into the Omaha and Sioux Falls markets, where Mowrer hadn’t aired ads, or at least not as many. Also compare the results map with the media market map:

So, how did DeJear still pull off the upset? Take a look at each candidate’s top 10 best counties percentage-wise. Here’s Mowrer’s:
| Polling | Mowrer % | Total | |
| Adams | 133 | 74% | 179 |
| Ringgold | 209 | 74% | 284 |
| Calhoun | 285 | 73% | 393 |
| Carroll | 412 | 71% | 577 |
| Guthrie | 362 | 71% | 509 |
| Union | 333 | 71% | 472 |
| Lucas | 206 | 70% | 293 |
| Humboldt | 210 | 69% | 304 |
| Palo Alto | 239 | 69% | 346 |
| Kossuth | 492 | 69% | 713 |
Mowrer’s best-performing counties were in many smaller, rural counties out in Western Iowa. He did win Polk County, but only with 52% of the vote. And all those small county wins couldn’t compete with the margins DeJear racked up in Eastern Iowa:
| Polling | DeJear % | |
| Jefferson | 1,055 | 70% |
| Winneshiek | 732 | 70% |
| Johnson | 9,430 | 68% |
| Scott | 4,329 | 63% |
| Muscatine | 731 | 62% |
| Black Hawk | 3,574 | 61% |
| Cedar | 519 | 61% |
| Washington | 423 | 60% |
| Louisa | 170 | 58% |
| Sioux | 211 | 58% |
DeJear’s best percentages came in many of the state’s largest counties. She also won Linn County with 58% and Dubuque County with 57%. Those margins helped her compile some big vote totals out east and overcome Mowrer’s advantage in the areas of the state he’d run in before.
While DeJear campaigned across the state and had a lot activists helping her, neither campaign had enough money to run a huge, statewide effort. There was enough on both sides for some staff, digital ads and very few mailings, but not much else. The results show once again the importance (though not supremacy) of residual name ID even in years where Democrats are favoring female candidates.
Secretary Of Agriculture Map
Speaking of fun maps, take a look at Republicans’ map for their five-way primary for secretary of agriculture. Less fun is the anguish that Mike Naig must certainly have felt when he got 34.74% of the vote, just a hair shy of the 35% needed to avoid a convention, which he very well may not win.
I would suggest keeping your eye on State Senator Dan Zumbach. He represents Delaware County and part of rural Linn County, and has deep ties throughout the farming community in Eastern Iowa. He’s in the medium-green counties here (see the interactive map here):

Naig, who was appointed as the acting secretary after Bill Northey left, won vast swaths of the middle of the state (he’s the light green), while Ray Gaesser of the Iowa Soybeans Assocation, who lives in Adams County, won his Southwest Iowa turf.
What Rural Problem?
Hubbell carried 96 of 99 counties in the primary. That’s an impressive achievement and will go a long way to dispelling fears about his appeal in rural parts of the state. Here’s his top ten best-performing counties, all of which are rural ones mostly in the western and central part of the state:
| Hubbell % | |
| Carroll | 70% |
| Wayne | 70% |
| O’Brien | 69% |
| Clarke | 68% |
| Tama | 67% |
| Guthrie | 67% |
| Franklin | 67% |
| Lucas | 67% |
| Hamilton | 67% |
| Appanoose | 66% |
Of course, winning rural areas in a Democratic primary doesn’t automatically mean Hubbell will win over vast numbers of independents and some Republicans. But it’s a far better sign than, say, had Hubbell only racked up his victory in the urban areas and someone like Norris carried most of the rural places. There’s something about Hubbell’s persona that appeals to the rural mindset, and that’s a good thing for Democrats.
Other Notes On Governor’s Race
Most of Norris’ best counties were in Southwest Iowa, where he grew up in Red Oak. But he also got 32% of the vote in Winneshiek County. The Democrats up in Decorah are very involved, and Norris seemed to do well connecting with folks one time when I saw him speak there.
Cathy Glasson very nearly won Jefferson County, getting 38% to Hubbell’s 39% there. Her third-best county was her own of Johnson, but even Hubbell won a solid 43% in the state’s most liberal county. She also did well in low-turnout Pottawattamie (29%), as well as Poweshiek (28%) and Story (25%), places where her campaign and CCI targeted the student vote.
Andy McGuire did well in Pottawattamie (17%), where she had the backing of Mike Gronstal and key local party activists. Her other strong counties were out west in Ida (27%), Mills (23%) and Lyon (19%).
And Ross Wilburn pulled in 5% of the Johnson County vote where he once served as mayor. Considering the massive turnout that Johnson County saw, that’s actually not half bad.
It seems like media markets also played a role in where Hubbell was weakest in the primary. Here’s his eight weakest counties:
| Hubbell % | |
| Montgomery | 15% |
| Mills | 23% |
| Fremont | 26% |
| Louisa | 33% |
| Lyon | 33% |
| Pottawattamie | 35% |
| Osceola | 36% |
| Harrison | 37% |
Aside from Boulton’s Louisa, all of these are in the media markets Hubbell did not run ads in (for good reason – there’s little Iowa overlap). Montgomery, Mills, Fremont, Pottawattamie and Harrison all get Omaha TV. And Lyon and Osceola are the two Iowa counties in the Sioux Falls media market.
Boulton Wins His Home County
Family and friends of Columbus Junction’s Nate Boulton stuck with their hometown kid on Election Day, even though he had dropped out of the race. Boulton won Louisa County with 39% of the vote. Only 86 Democrats had voted early in Louisa County (likely mostly for Boulton, but not all), and Boulton ended up with 139 votes there altogether. It would have been interesting what the map would look like had the Des Moines Register story not come out. Boulton got 22% in Lee County and 12% in Henry County. That southeast corner of the state was his stronghold.
The other two counties that Hubbell didn’t win was Montgomery County; John Norris won his home county there with 69% of the vote. And Cathy Glasson carried small Mills County with 31% (progressive activists have a couple well-organized spots in Southwest Iowa).
Stewart vs. Malloy’s Hometown Advantages
In plenty of past primaries and legislative races, we’ve seen the importance of a candidate’s hometown support in getting over the finish line. But I don’t believe there’s been as lopsided a divide as we saw in the SD 41 Democratic primary for retiring Senator Mark Chelgren’s seat. Check it out:
| Ed Malloy | Mary S. Stewart | ||||
| Polling | Malloy % | Polling | Stewart % | Total | |
| Davis | 120 | 19% | 518 | 81% | 638 |
| Jefferson | 1,621 | 81% | 374 | 19% | 1999 |
| Van Buren | 99 | 34% | 192 | 66% | 291 |
| Wapello | 233 | 11% | 1,825 | 89% | 2061 |
| Total: | 2,073 | 42% | 2,909 | 58% | 4989 |
It looked like retired educator and Democratic activist Mary Stewart of Ottumwa was going to win this handily several weeks ago when Wapello County’s early vote far outpaced Jefferson’s. But Fairfield Mayor Ed Malloy’s neighbors rallied to his cause and Jefferson County’s absentee ballot count jumped just before Election Day. The two counties were nearly tied for final turnout, despite Wapello having 7,857 registered Democrats to Jefferson’s 3,933.
Both candidates utterly dominated their home turf. Malloy’s 81% in Jefferson is stunning, but it’s only outdone by Stewart’s incredible 89% in Wapello. Remember: a lot of primary voters go into the election booth not knowing much about down-ballot races, so there’s always some dart-throwing picks there, meaning it’s difficult for any candidate to get over 80%. But this primary must have dominated locals’ attention.
Stewart’s strong performances in the district’s two rural counties, Davis and Van Buren, put her over the top.
Congressional Notes
In the 1st District, Thomas Heckroth won his home county of Bremer with 54% of the vote. Finkenauer compiled a huge lead out of Dubuque with 84%.
Over in the 4th District, Leann Jacbosen of Spencer won nine counties, including several of those around her home base of Clay County. J.D. Scholten built up a very large lead in Woodbury County, which saw high turnout, with his 67% total there.
Other Observations
Starting Line is going to go on a break from writing here soon, but I should put out a few more stories about interesting turnout numbers and trends. We only get fun data like this to mess around with every so often, so I want to explore it some more, it just may not be right away (as you can imagine, I’m a little tired post-primary).
by Pat Rynard
Posted 6/8/18

Politics
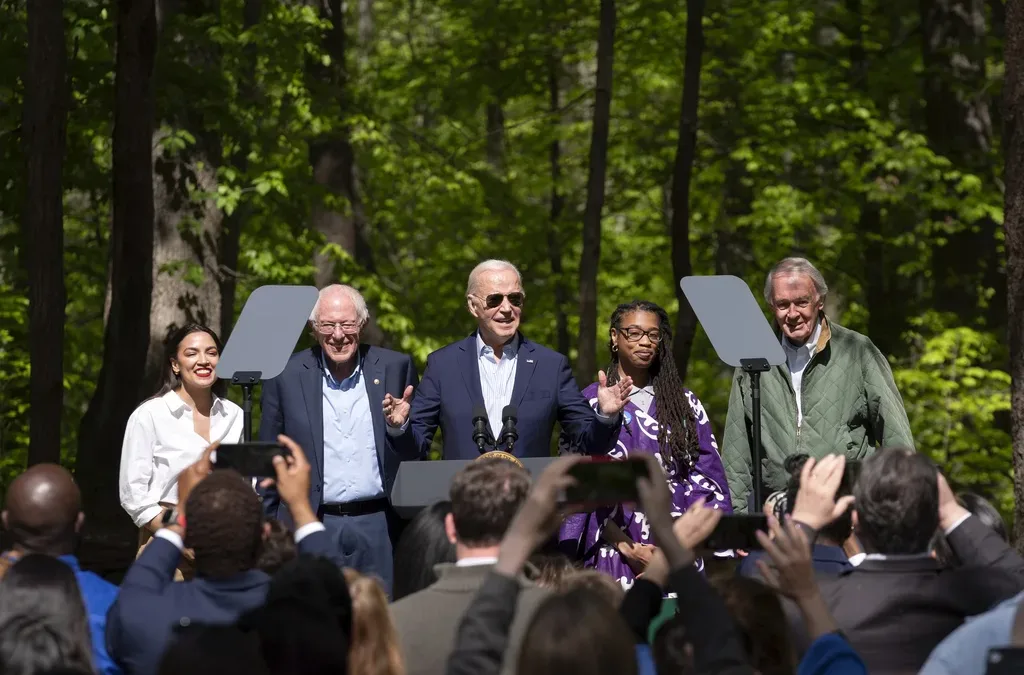
Biden marks Earth Day by announcing $7 billion in solar grants
The Biden administration on Monday announced the recipients of its Solar For All Program, a $7 billion climate program that aims to lower energy...

6 terrifying things that could happen if the Comstock Act is used to target abortion
Does 1873 sound like a really, really long time ago? Well, that’s because it is—but if Republicans and far-right anti-abortion activists have their...
Local News
No more Kum & Go? New owner Maverik of Utah retiring famous brand
Will Kum & Go have come and gone by next year? One new report claims that's the plan by the store's new owners. The Iowa-based convenience store...

Here’s a recap of the biggest headlines Iowa celebs made In 2023
For these famous Iowans, 2023 was a year of controversy, career highlights, and full-circle moments. Here’s how 2023 went for the following Iowans:...