
Before we move completely on the general election, let’s take one last look at some of the specific numbers from last week’s Iowa primary. For a website like Starting Line, we love having numbers to pore over and didn’t want to move on before examining a few more interesting trends.
One thing I think you can discover in these numbers is how voters make their decisions in little-publicized, low-turnout elections. For many of the Iowa primary races, press coverage was limited to a handful of news articles and campaigns didn’t spend nearly as much on advertising as will happen in the general election. And in certain areas of the state where a county supervisor race drew out large amounts of voters, those people voting for their local friends and neighbors may have known little about the Senate and Congressional races.
You can take a look at the excel file I threw together (Iowa Primary 2016 Results) to play around with some of the results if you’d like, while you can also find a results map at the Register and the official list from the Secretary of State.
The Importance Of A Media Market
Monica Vernon swept to victory in the 1st District, beating Pat Murphy 67.7% to 32.3%. Murphy, as expected, still did well in his home county of Dubuque, getting 53.1% there.
But he did win one other: Marshall County, with 50.3% of the vote. (I was particularly amused by this because when I spent a day with Murphy, he specifically mentioned that he thought he’d do well in in Marshalltown.)
What makes Marshall County different? The main factor is likely that it’s one of the few counties in the 1st District not in the Cedar Rapids-Waterloo media market. This isn’t to take away from Murphy’s personal connections there or his campaign’s efforts, but a lack of Vernon TV ads there likely helped. When Vernon visited Tama, one county over, most of the voters mentioned how they’d seen her on TV.

Iowa media markets
This doesn’t track perfectly throughout the district. Jackson, Poweshiek, Howard, Mitchell and Worth counties are the other 1st District counties outside the main media market. Murphy nearly won Worth (49.1%), but did poorly in Jackson (36.1%). Still, he did outperform his average in all of those counties.
This presents interesting challenges that all campaigns have to deal with. Vernon and Rod Blum will likely never advertise in the Des Moines media market just to hit two counties. So they’ll both need a stronger ground game there (or more mailers) to spread their message in Marshalltown. It’s always been difficult for the 3rd District: advertising in the expensive Omaha media market rarely makes sense, but Council Bluffs still accounts for a decent amount of votes.
Again, all of this is obvious stuff, it’s just interesting to see it play out in the numbers: an inability to run TV ads has a big impact on how much the voters know of a candidate, which is difficult to make up through other ways.
How The Des Moines Suburbs Voted
A large share of Starting Line’s readership is from the Des Moines area, so I thought we’d take a close look at how each Des Moines municipality broke down. Here’s the 3rd District race by city in Polk County:
| Adams | Mowrer | Sherzan | Adams | Mowrer | Sherzan | |
| City | Votes | Votes | Votes | % | % | % |
| Des Moines | 1714 | 5278 | 4279 | 15% | 47% | 38% |
| Altoona | 41 | 220 | 170 | 10% | 51% | 39% |
| Ankeny | 152 | 692 | 432 | 12% | 54% | 34% |
| Clive | 76 | 216 | 175 | 16% | 46% | 37% |
| Grimes | 17 | 80 | 58 | 11% | 52% | 37% |
| Johnston | 62 | 309 | 243 | 10% | 50% | 40% |
| Pleasant Hill | 42 | 232 | 238 | 8% | 45% | 46% |
| Urbandale | 152 | 676 | 402 | 12% | 55% | 33% |
| West Des Moines | 245 | 873 | 553 | 15% | 52% | 33% |
| Windsor Heights | 82 | 184 | 132 | 21% | 46% | 33% |
Mowrer’s best cities were Urbandale and Ankeny. Sherzan won Pleasant Hill and was his best suburb by a decent margin. Adams polled the best in Windsor Heights, Clive, Des Moines and West Des Moines.
As we wrote before, a “Mowrer voter” or a “Sherzan voter” demographic trend never really emerged from the 3rd District race, and both of their percentages didn’t swing wildly from suburb to suburb. So does this tell us anything? Well, let’s compare it to the Senate breakdown (see my spreadsheet for vote totals):
| Fiegen | Hogg | Judge | Krause | |
| City | ||||
| Des Moines | 6% | 41% | 47% | 6% |
| Altoona | 6% | 39% | 50% | 5% |
| Ankeny | 6% | 44% | 45% | 4% |
| Clive | 5% | 55% | 38% | 2% |
| Grimes | 4% | 50% | 42% | 4% |
| Johnston | 5% | 54% | 37% | 4% |
| Pleasant Hill | 7% | 35% | 50% | 9% |
| Urbandale | 5% | 56% | 35% | 4% |
| West Des Moines | 6% | 52% | 38% | 3% |
| Windsor Heights | 9% | 53% | 35% | 3% |
Patty Judge performed best in Altoona, Pleasant Hill and Des Moines. Rob Hogg won Clive, Grimes, Johnston, Urbandale, West Des Moines and Windsor Heights. Bob Krause and Tom Fiegen did well in Pleasant Hill, and just Fiegen over performed in Windsor Heights.
So what do these numbers mean? The main theory on the Senate race is that Hogg did well in parts of the state where the electorate was more tuned into the race. Judge did her best where voters were relying on past name ID only. And while Fiegen had specific liberal areas in the state where he over-performed, it seemed like Fiegen and Krause did best in strong Judge areas where people were also just throwing darts at the ballot between the four.
That would seem to indicate that Pleasant Hill and Altoona – 50% areas for Judge – are areas of Polk County where the Democratic voters were least tuned-in to the race. Windsor Heights was the most interested, going strong for Hogg, but also giving Fiegen, the main ideological candidate, a decent percentage while simultaneously ignoring Krause.
Hogg also did notably well in the suburbs of Johnston and Urbandale, where the local neighborhood Democratic organizations are strongest. And a large concentration of Hogg’s best precincts were in Starting Line’s neck of the woods, out in West Des Moines around Valley West High School.
This could be informative for future statewide candidates: Polk County is of course the largest in the state, but your early visits might want to focus on Johnston, Urbandale, Clive and West Des Moines, where the local activists are paying the most attention. Perhaps a few extra rounds of paid mail should go to places like Altoona and Ankeny, where voters seem to not seek out as much information on their own. Des Moines proper contains way more votes, but Hogg nearly won Polk County with a string of suburban victories.
Polk County’s Minority Vote
Looking back at the 3rd District, I suggested on Election Day that readers watch several precincts with high African American and Hispanic populations to see how well Desmund Adams did there. Adams often mentioned how much he built a coalition of local leaders from Des Moines’ minority communities. Did they come through? Yes and no.
Here’s the Des Moines precincts with the largest concentration of African American voters:
| Adams | Mowrer | Sherzan | Adams | Mowrer | Sherzan | |
| Votes | Votes | Votes | % | % | % | |
| Des Moines 18 | 22 | 26 | 12 | 37% | 43% | 20% |
| Des Moines 33 | 23 | 30 | 25 | 29% | 38% | 32% |
| Des Moines 34 | 8 | 16 | 7 | 26% | 52% | 23% |
| Des Moines 35 | 20 | 7 | 12 | 51% | 18% | 31% |
| Des Moines 36 | 34 | 18 | 8 | 57% | 30% | 13% |
| Des Moines 37 | 15 | 18 | 8 | 37% | 44% | 20% |
Adams easily won two of the precincts, and significantly outperformed his average percentage in the others. I wasn’t able to find turnout percentages (or registration by precinct numbers), so we’ll have to wait for the official canvass to see what these precincts’ turnouts looked like. But even in his best precincts, Adams still only got totals of 20 votes and 34 votes.
The Hispanic vote is a little more dispersed in Des Moines, but of the precincts with the heaviest concentration, Adams didn’t get a lot:
| Adams | Mowrer | Sherzan | Adams | Mowrer | Sherzan | |
| Votes | Votes | Votes | % | % | % | |
| Des Moines 22 | 25 | 54 | 51 | 19% | 42% | 39% |
| Des Moines 32 | 16 | 41 | 52 | 15% | 38% | 48% |
| Des Moines 33 | 23 | 30 | 25 | 29% | 38% | 32% |
| Des Moines 48 | 0 | 9 | 1 | 0% | 90% | 10% |
| Des Moines 49 | 3 | 13 | 11 | 11% | 48% | 41% |
| Des Moines 52 | 8 | 27 | 16 | 16% | 53% | 31% |
Near the end of the campaign, Adams received the endorsement of the Asian and Latino Coalition after a hosted forum from the organization. The Asian population is particularly spread out, mostly on Des Moines’ South Side, but there are two precincts north of Easter Lake with the highest concentration:
| Adams | Mowrer | Sherzan | Adams | Mowrer | Sherzan | |
| Votes | Votes | Votes | % | % | % | |
| Des Moines 50 | 10 | 36 | 34 | 13% | 45% | 43% |
| Des Moines 51 | 8 | 16 | 13 | 22% | 43% | 35% |
All of this is a little disconcerting for a number of reasons. The largest is that Democrats need these communities to turn out in large numbers to oppose Donald Trump in November. So far, despite the best efforts of local activists and community groups, it seems they’re still having trouble actually getting their people to the polls. Yes, primaries are always difficult to motivate people for, but these leaders may need to revisit their strategies, take a close look at their numbers and figure out what different tactics they could employ for the Fall.
Other Interesting Senate Counties
We looked at the top 10 counties last week, but there were a number of other notable county-specific results. Here’s the map from the Secretary of State’s office:

Bob Krause’s best county was Lee County in the Southeast corner:
Lee County:
Judge: 40.9%
Hogg: 26.4%
Krause: 24.8%
Fiegen: 7.8%
The county that holds Fort Madison and Keokuk is always interesting, as it’s in the Quincy/Hannibal media market. They’re sometimes a little detached from what happens in the rest of Iowa, so their results were intriguing.
Tom Fiegen won Jefferson County (38.9% Fiegen – 36.6% Hogg), home to Fairfield and the Maharishi. They typically give the most liberal candidate a big win. But Fiegen surprisingly only got 11.8%, with 103 overall votes, in Cerro Gordo County where the Prestage Farms controversy gave him some big publicity. Fiegen was on the front lines of that fight, so it’s odd he didn’t receive more votes there.
4th District – Bertrand’s Strength
As I mentioned before, Steve King’s inability to completely destroy Rick Bertrand, whose campaign wasn’t very visible, could cause problems for him in the future. A better-financed challenger who has more time to prepare could see King’s 65% win as an invitation in the years to come. But it’s not clear where the best opportunity comes from in the district.
Here’s Bertrand’s best 10 counties:
| King | Bertrand | Total | King | Bertrand | |
| Cherokee | 1017 | 908 | 1925 | 53% | 47% |
| Clay | 1939 | 1517 | 3456 | 56% | 44% |
| Woodbury | 3385 | 2620 | 6005 | 56% | 44% |
| Dickinson | 436 | 330 | 766 | 57% | 43% |
| Plymouth | 1136 | 827 | 1963 | 58% | 42% |
| Greene | 602 | 409 | 1011 | 60% | 40% |
| Ida | 448 | 269 | 717 | 62% | 38% |
| Franklin | 711 | 421 | 1132 | 63% | 37% |
| Hardin | 320 | 188 | 508 | 63% | 37% |
| O’Brien | 1748 | 1012 | 2760 | 63% | 37% |
There’s not really a pattern here. Bertrand was expected to do well in Woodbury, but you might think he’d had over-performed in the new part of the 4th district out east. Not so. Most of his best counties came in the heart of conservative northwest Iowa.
That could make a future challenge to King all the more tempting. With a stronger campaign, another Republican could do better in Story and Cerro Gordo County. There’s already unease with King in the part of the district you’d think he’d be strongest in. This reinforces the idea out in Western Iowa that while the conservative activists love King, the local elected and business leaders – mostly Republicans – do not.
Mauro’s Southside Appeal
Back to Polk County: the Mauro name has always been a strong one in Des Moines politics, but their appeal may by contained to the South Side. Here’s how the precincts went in the Mauro-Oldson primary:
| Mauro | Oldson | Mauro % | Oldson % | |
| Des Moines 40 | 37 | 76 | 33% | 67% |
| Des Moines 43 | 65 | 242 | 21% | 79% |
| Des Moines 44 | 74 | 248 | 23% | 77% |
| Des Moines 45 | 18 | 87 | 17% | 83% |
| Des Moines 57 | 41 | 117 | 26% | 74% |
| Des Moines 58 | 53 | 207 | 20% | 80% |
| Des Moines 59 | 58 | 200 | 22% | 78% |
| Des Moines 60 | 96 | 224 | 30% | 70% |
| Des Moines 61 | 79 | 323 | 20% | 80% |
| Des Moines 62 | 113 | 428 | 21% | 79% |
| Des Moines 63 | 46 | 247 | 16% | 84% |
| Des Moines 64 | 101 | 133 | 43% | 57% |
| Des Moines 65 | 303 | 162 | 65% | 35% |
| Des Moines 82 | 256 | 42 | 86% | 14% |
| Total Votes | 1340 | 2736 | 33% | 67% |
Precinct 82 is by the airport, 65 is west of Fleur between Park Ave and Watrous, and 64 is north of Park Ave. Mauro won the first two overwhelmingly, and put up good raw vote totals there as well. But that was the only place his challenge took hold. Despite a strong and spirited campaign by Mauro, challenging an incumbent in most cases is too much of an uphill battle.
Homefield Advantage
For potential candidates looking to run in the future, a big consideration is where your base of support in a district lies. A lot of these local primaries turn into a friends-and-neighbors affair, where it comes down to which candidate’s neighborhood/hometown can turn out bigger for them.
Consider the Democratic primaries in HD 77 and HD 55. Here’s how the Amy Nielsen-Abbie Weipert primary shook out by precinct:
| Nielsen | Weipert | Nielsen % | Weipert % | |
| Precinct | ||||
| Absentee | 84 | 65 | 56% | 44% |
| NL 1 | 40 | 8 | 83% | 17% |
| NL 2 | 79 | 19 | 81% | 19% |
| NL 3 | 73 | 21 | 78% | 22% |
| NL 4 | 38 | 8 | 83% | 17% |
| NL 5 | 29 | 7 | 81% | 19% |
| NL 6 | 49 | 16 | 75% | 25% |
| Clear Creek | 30 | 56 | 35% | 65% |
| Fremont-Lincoln | 34 | 39 | 47% | 53% |
| Hardin | 16 | 21 | 43% | 57% |
| Jefferson east | 42 | 19 | 69% | 31% |
| Jefferson W – Monroe | 37 | 23 | 62% | 38% |
| Liberty-Pleasant Valley | 20 | 11 | 65% | 35% |
| Oxford | 29 | 23 | 56% | 44% |
| Sharon | 12 | 7 | 63% | 37% |
| Union | 18 | 20 | 47% | 53% |
| Washington | 18 | 6 | 75% | 25% |
| West Lucas | 19 | 14 | 58% | 42% |
| Total | 667 | 383 | 64% | 36% |
Nielsen represents North Liberty, the largest city in the district. Weipert hails from Tiffin in the rural part of the district. As you can see, Nielsen racked up big wins in the six North Liberty precincts. Tiffin is in Clear Creek, where Weipert won with 26 more votes than Nielsen. Nielsen’s home base was simply too much to overcome.
However, you don’t always have to come from the larger city in the district. Take the Democratic primary in HD 55. Decorah has 8,127 residents, West Union has 2,486. Steve McCargar is from Decorah (Winneshiek County), Pat Ritter from West Union (Fayette County). But Ritter ended up winning because his hometown was more lopsided for him than McCargar’s:
| Couty | Ritter | McCargar | Ritter | McCargar |
| Clayton | 161 | 61 | 73% | 27% |
| Fayette | 264 | 53 | 83% | 17% |
| Winneshiek | 445 | 700 | 39% | 61% |
| 870 | 814 | 52% | 48% |
Despite the lower number of voters in Fayette, Ritter’s 83% win in his home county outdid McCargar’s 61% victory in his own. Considering Ritter also took Clayton, I’m guessing he simply ran the stronger campaign here. In general elections you typically would prefer your candidate be from the larger population center, but Ritter has already shown an ability to pull off a win despite that. That bodes well for Democrats’ hopes in this must-win seat.
by Pat Rynard
Posted 6/14/16

Politics
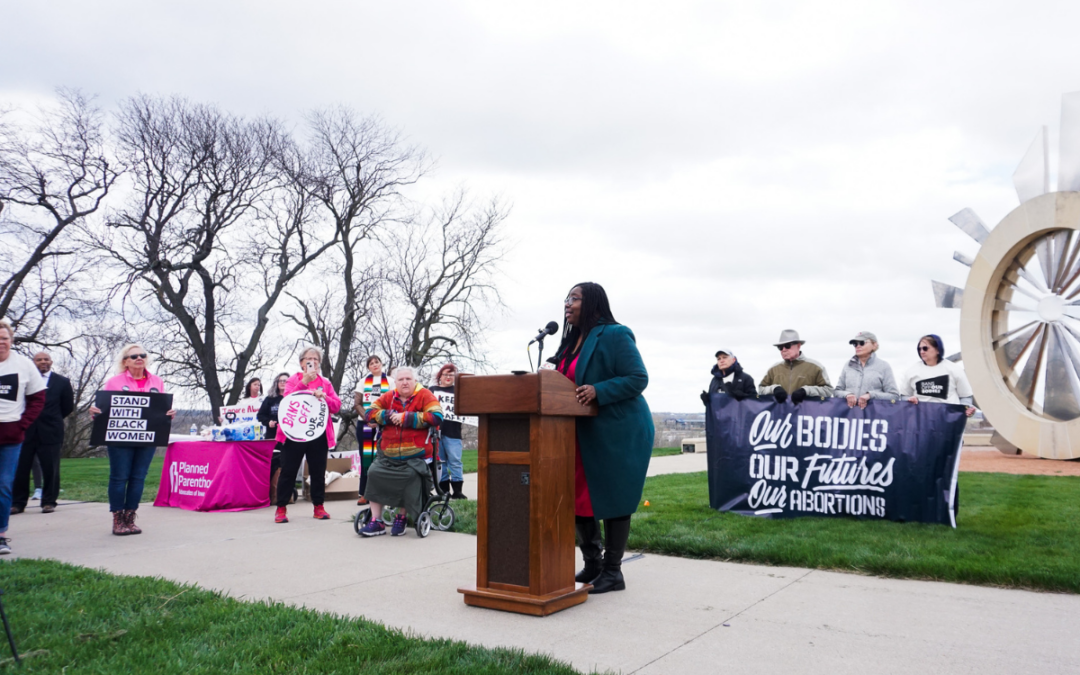
Abortion supporters rally before Iowa Supreme Court arguments
Abortion saved her life seven years ago and Leah Vanden Bosch is more grateful for it now than ever. Vanden Bosch, who serves as the development and...
New VA program to help more than 40,000 veterans stay in their homes
The Department of Veterans Affairs (VA) will launch a “last resort” program for tens of thousands of American veterans who are in danger of losing...
Local News
No more Kum & Go? New owner Maverik of Utah retiring famous brand
Will Kum & Go have come and gone by next year? One new report claims that's the plan by the store's new owners. The Iowa-based convenience store...

Here’s a recap of the biggest headlines Iowa celebs made In 2023
For these famous Iowans, 2023 was a year of controversy, career highlights, and full-circle moments. Here’s how 2023 went for the following Iowans:...


